Q2 2020 Report – April, May, June
 Updated on January 24, 2025

It’s that time of the year again where we publish our numbers and activity for the previous quarter.
The year has been a wild ride of ups and downs. In Q1 we felt the pain of the pandemic and encroaching economic recession, but in Q2 our company soared to some of our best months ever.
The second quarter of 2020 has made us more confident in the resiliency of our business model and online businesses in general as profitable digital assets. It has reaffirmed long-held (but untested) beliefs for us, and fortunately, we came out in the way we hoped we would—better than ever.
It remains to be seen if the trends of Q2 will continue into Q3, but we’re in an optimistic position on that front.
Alright, let’s dive into the actual revenue numbers of Q2 along with all the other metrics to really dissect what happened over this 3-month time period.
Executive Summary: Q2 2020 Report
Q2 2020 Business Data
Business Data
Total team members: 64
Founders: 2
Sales team members: 14
Marketing team members: 8
Operations team members: 28
Engineering team members: 7
Human resources team members: 1
Finance team members: 1
Contractors: 3
Email subscribers: 124,994
Podcast downloads: 44,146
Site visits: 430,766
Brokered site sales
Listing fees: $6,819.00
Additional/other revenue: $50.02
Average deal size: $182,248.68
Total revenue: $16,584,630.10
Earnings
Brokered site earnings: $1,782,248.99
Listing fees: $ 6,819.00
Additional revenue: $50.02
Total gross earnings: $1,789,118.01
Fifteen Seven-Figure Businesses for Sale Right Now
Last quarter, when we were writing this report, we had fourteen 7-figure businesses for sale on our marketplace. That was the highest amount we’ve ever had for sale at any one time—until now.
As of writing this, we have fifteen seven-figure businesses. But there’s a slight caveat—one of those businesses is actually an 8-figure business!
Despite the world events going on, we continue to show the resilience of our marketplace and in general the resilience of the online business world as a whole in the face of uncertainty.
Let’s dive into each business briefly. Feel free to click the marketplace listing link to learn more about each one. And if you want the full-featured access to our marketplace, make sure you register for an account here.
- Listing #47459 (Pending Sold): An Amazon FBA and e-commerce business created in January 2016. This 8-figure business operates in the personal care and bed & bath niches. It features 3 brands that boast 26 SKUs across them. The business is valued at $11,883,060.
- Listing #44985: An Amazon FBA and e-commerce wholesaler created in August 2014 in the electronics niche. 85% of the revenue is generated through Amazon, but the business also employs multichannel selling across its own Shopify store, the Walmart marketplace, and the Newegg marketplace. The business is valued at $2,705,978.
- Listing #47198: An Amazon FBA business created in October 2017 in the health & fitness and beauty niches. The business promotes 3 SKUs in the USA and UK marketplaces that address pain relief. The business is valued at $2,411,665.
- Listing #46775: A subscription business created in December 2016 in the health & fitness and food & beverage niches. The business features a large, engaged email list and a solid recurring revenue. The business is valued at $2,233,448.
- Listing #47581: Created in September 2014, this business boasts multiple monetizations from affiliate offers, info products, display ads, and subscriptions. The business is valued at $1,997,930.
- Listing #47897: This business features multiple monetizations, such as SaaS, applications and affiliate offers. The business was created in January 2018 and is valued at $1,897,387.
- Listing #47807: A digital product and dropshipping business created in February 2019 in the health & fitness niche. The business includes a large email plus custom automation to help deliver the digital product and various other products more easily to the customers. The business is valued at $1,865,600.
- Listing #47242: An affiliate site created in January 2017 in the survival and security niche. The business has seen steady growth with no signs of seasonality as it continues to climb in organic search. The business is valued at $1,547,094.
- Listing #47101: An Amazon FBA business created in December 2016 in the gifts & occasions niche. It boasts 95 SKUs related to all-natural products. The business is valued at $1,496,745.
- Listing #46538: A SaaS business created in January 2009 in the business niche. The business helps professionals find and connect with each other. It also features a large email list with an engaged social media following. The business is valued at $1,201,686.
- Listing #47639: A two-site package of affiliate sites, both Amazon and non-Amazon affiliates, in the news & education niche. The business has steady year over year growth in both traffic and revenue. The business is valued at $1,156,880.
- Listing #47834: An e-commerce business created in April 2000 in the entertainment niche. At 20 years old, the business is established with a large customer database and email list. The business is valued at $1,154,800.
- Listing #47915: This listing is for an e-commerce, Amazon FBA and wholesale business created in January 2010 in the food & beverage niche. This asset is in a great place for SEO growth as their main site has a DR 72 and the business has built an email list of over 250,000 people. In addition, this business comes with a talented staff of 19 members. The business is valued at $1,153,105.
- Listing #47214: An e-commerce business created in April 2018 in the beauty niche. The business employs 3 part-time VAs to handle the majority of the day to day work in the business that sells trademark cosmetics. The business also boasts an email list of over 50,000 subscribers. The business is valued at $1,087,845.
- Listing #47832: An Amazon associates and display advertising site created in January 2018 in the culinary niche. The business shows strong growth with minimal time needed to maintain the asset. The business is valued at $1,084,957.
There is a ton of opportunity in these listings for the right buyer. If you have already registered for an account with us but you’d like to talk to one of our business analysts about how to go about acquiring one of the businesses above, you can set up a time to chat with us here.
If you’re wondering if your business could be sold for 7-figures, then fill out our free automated valuation tool here. It’ll give you a ballpark rough estimate of what your business could be sold for using real sales data from our marketplace.
Revenue Breakdown
Brokered Site Revenue
Here’s a look at our overall marketplace sales:
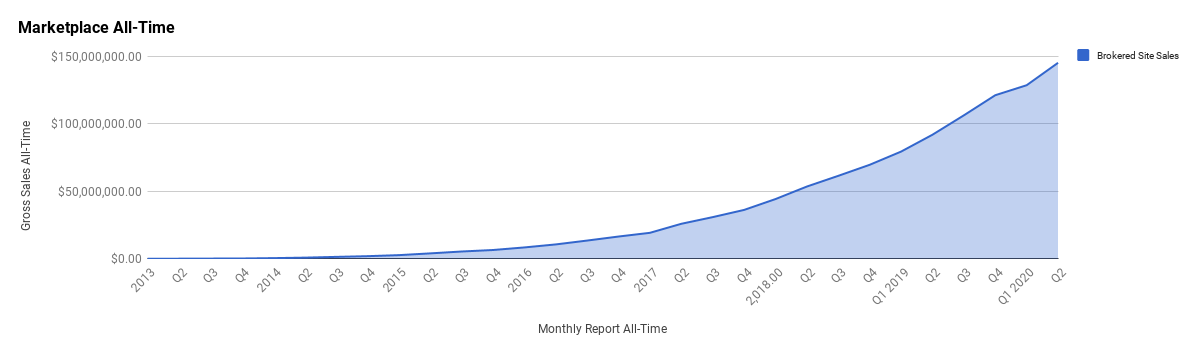
If you remember from our Q1 report, sales began to taper off towards the end of the quarter. In Q2 we saw record growth, which can be seen in the chart above. The growth makes the dip we felt in Q1 look like a small blip, but we assure you it was a painful blip.
The story of Q1 and the recovery in Q2 is much more stark when you look at the same numbers in a quarter by quarter breakdown.
Below is a breakdown of our quarter by quarter growth:
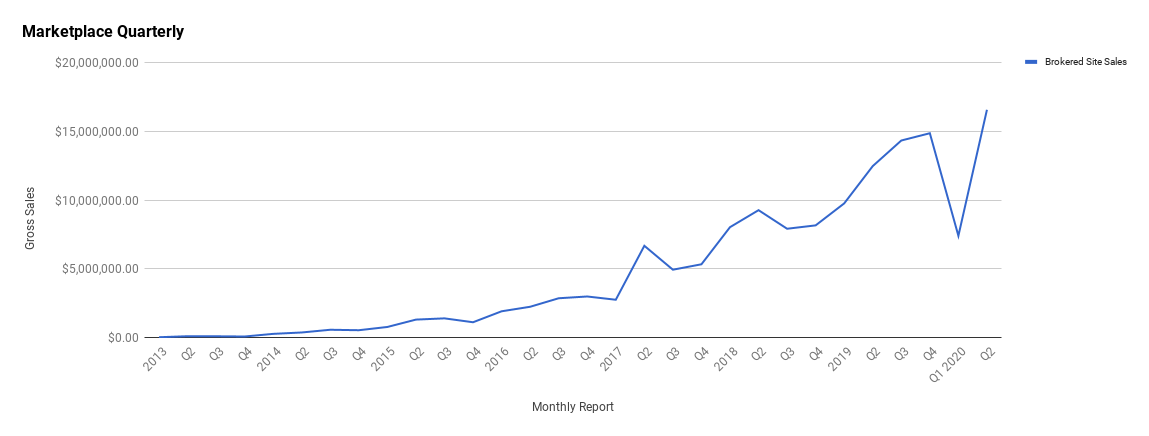
As you can see, we experienced a deep V-shaped recovery as the world began to adapt to the new normal of a global pandemic. In Q1, we achieved $7,408,475.52 in revenue, less than half as much as we did in Q2, where we were able to bring in $16,584,630.10
This was a huge recovery for us. In fact, the recovery was so good that Q2 became the highest revenue ever earned in the history of our company.
It’s not what we expected. We did expect that we would be able to survive and weather the storm going on in the world, but we certainly didn’t think we were on the precipice of our greatest quarter ever. Of course, the world is by no means a calm and certain place right now, which makes it hard to predict if Q3 will be equally as great as Q2 was for us.
Another interesting statistic is the number of businesses we sold in Q2.
In Q1, we only sold 53 businesses, which was low but not terribly far away from Q4 2019 when we sold 59 businesses. Both Q4 2019 and Q1 2020 marked a lower number of businesses sold in a given quarter for us, with Q3 2019 being 78 and other quarters averaging above 60.
In Q2 2020, we blew past these numbers, selling 91 businesses.
We sold more businesses in Q2 2020 than there are business days in the quarter.
This is quite a feat, and one we’re pretty proud that we were able to pull off.
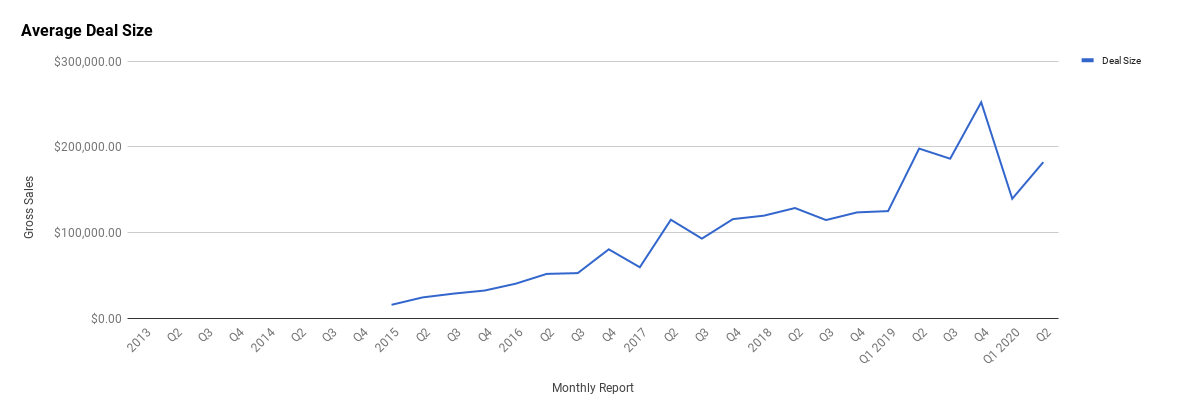
However, we didn’t just recover in terms of the quantity of businesses sold and revenue, we actually recovered slightly in terms of the average deal size sold on the marketplace. In Q2, the average deal size was $182,248.68, while in Q1 it was only $139,578.81. You’ll see that Q2’s numbers are not fully recovered as our average deal size in Q4 2019 was a staggering $252,133.44.
But keep in mind we only sold 57 businesses in Q4 2019, which means there were likely a ton of smaller businesses sold in Q2 2020 that are pulling down the average considerably. The ability to sell 91 businesses and still hover right underneath an average deal size of $200k is a strong sales signal.
Here is how our average deal size has changed over time on the marketplace:
Will the trend continue?
Maybe. It depends on a large swath of highly variable factors. The story for the rest of the year in many ways will be decided by the events of Q3. We do believe we have reached a “new normal” in terms of the digital assets space, and normalcy breeds certainty, which in turn lends itself to investors and sellers once again taking meaningful action.
There was no certainty in Q1, everything was closer to pandemonium and the uncertainty froze most investors from deploying cash into acquisitions despite a ton of sellers still ready to exit their businesses. Now that we have reached a new normal, Q3 will likely be a pivotal quarter to see how the market will shift going forward.
Our average deal size was growing at a healthy pace before Q1 struck, so there is a chance that Q3 sees us beating out the average deal size of Q2. It also helps that we have listed our first 8-figure business.
Brokers and marketplaces, such as ours, always have a chicken and egg problem when it comes to breaking into either new pricing thresholds or new monetization. Not many entrepreneurs want to be the first 7-figure or 8-figure business to be listed with you because they want to know you can do what you’re saying you can do first. Once you can prove it though, it opens up the floodgates for similar businesses to start appearing on the marketplace.
The most obvious example of this is how it took us around 8-months to sell our very first 7-figure business years ago. It was a tough sell for many reasons outside of the fact that it was our first one. Now that we have sold that business, we routinely sell 7-figure businesses in less than 60 days and have entire systems, procedures, and processes in place to make the entire transaction smooth between buyers and sellers.
We went from doing our best to attain a 7-figure business and sell it to having more than 15 of these businesses listed for sale on our marketplace.
It is our prediction that once we sell that first 8-figure business, it will also open up a flood gate of deals at this pricing threshold, which will in turn bring up our average deal size considerably heading into 2021 and beyond.
All of this is especially great news for us because it is our belief it is actually easier to sell an 8-figure business than a 7-figure business. Once you’re at the 8-figure level, it opens you up to a swathe of new buyers (new capital) that just don’t exist as much at the 7-figure level.
If you run a business in the $XXM range, feel free to schedule an exit planning call with us.
We’re happy to walk you through our process and set you on a path towards a successful exit.
Business Listing Fees
Listing fees have always been a valuable tool for us but have never been a true profit center. The real reason we charge a listing fee is to weed out potential tire kickers and time wasters who have no real intention to sell their business.
The fee does help cover some of our vetting costs, but its main function is really just a qualifier for us.
In Q2 our listing fees were $6,819.00. This is down quite a bit from Q1 where we earned $10,759.00. Of course, that number is pretty small, relatively, and we didn’t really feel this dip. The explanation for the dip is also very clear to us. The first quarter of any year is always our highest season for people submitting their businesses for sale with us, followed by Q4. The middle quarters of the year tend to be our lowest submission period.
We charge $297 if you’re a first-time seller on our marketplace and $97 if you’re a returning seller.
Most people that pay this price will have their money refunded, since we reject close to over 80% of businesses that are submitted to our vetting team. If, for any reason, we decide we cannot list your business, or if you decide you don’t like the valuation we come up with, we refund the money no questions asked.
This makes our entire vetting experience no cost to you unless you agree with our valuation and are happy with the price. You always have that final say when you come to our marketplace.
If you’ve been on the fence because of the fee, then don’t worry. You can click here to sell with us, and if you don’t like the valuation we gave, we’ll refund your money.
Now that you have a clear picture of our finances, we’ve got some more good news on what happened in Q2 related to our audience growth.
Let’s dive in.

Traffic and Audience
Blog Traffic and Analytics
Our blog remains one of the highest traffic-generating assets for us, in addition to some of the SEO work we did in Q1, which is now making our actual marketplace rank for individual monetization pages. Q2 was a fantastic quarter for growing our favorite traffic channel—organic. The team worked hard to not only create a ton of new content but also optimize old pages and create effective internal linking throughout our website in an effort to help us rank better.
Before we dive into some analytics, let’s first look at a quick content update that might be interesting to you if you’re looking at buying online businesses from us.
We’ve been publishing more data-driven articles. We interviewed our buyers after six months of owning their newly acquired asset to see what went down and if they made a positive ROI or not. If you’re a buyer or are interested in what happens to digital assets after they’re purchased, then check out these research posts below:
- The Content ROI Study
- The Amazon FBA ROI Study
- Buy, Fix, and Flip Study
- The Lesser Known Digital Assets ROI Study
We’re currently working on an aggregate ROI study based on all the data above, which should be published later this quarter for you to take a look at. So, make sure you keep coming back to the blog. If you’re on our email list, you’ll be updated right when we publish. You can sign up for our email list by registering a free marketplace account.
Alright, let’s get into the data.
Here’s our traffic for Q2:
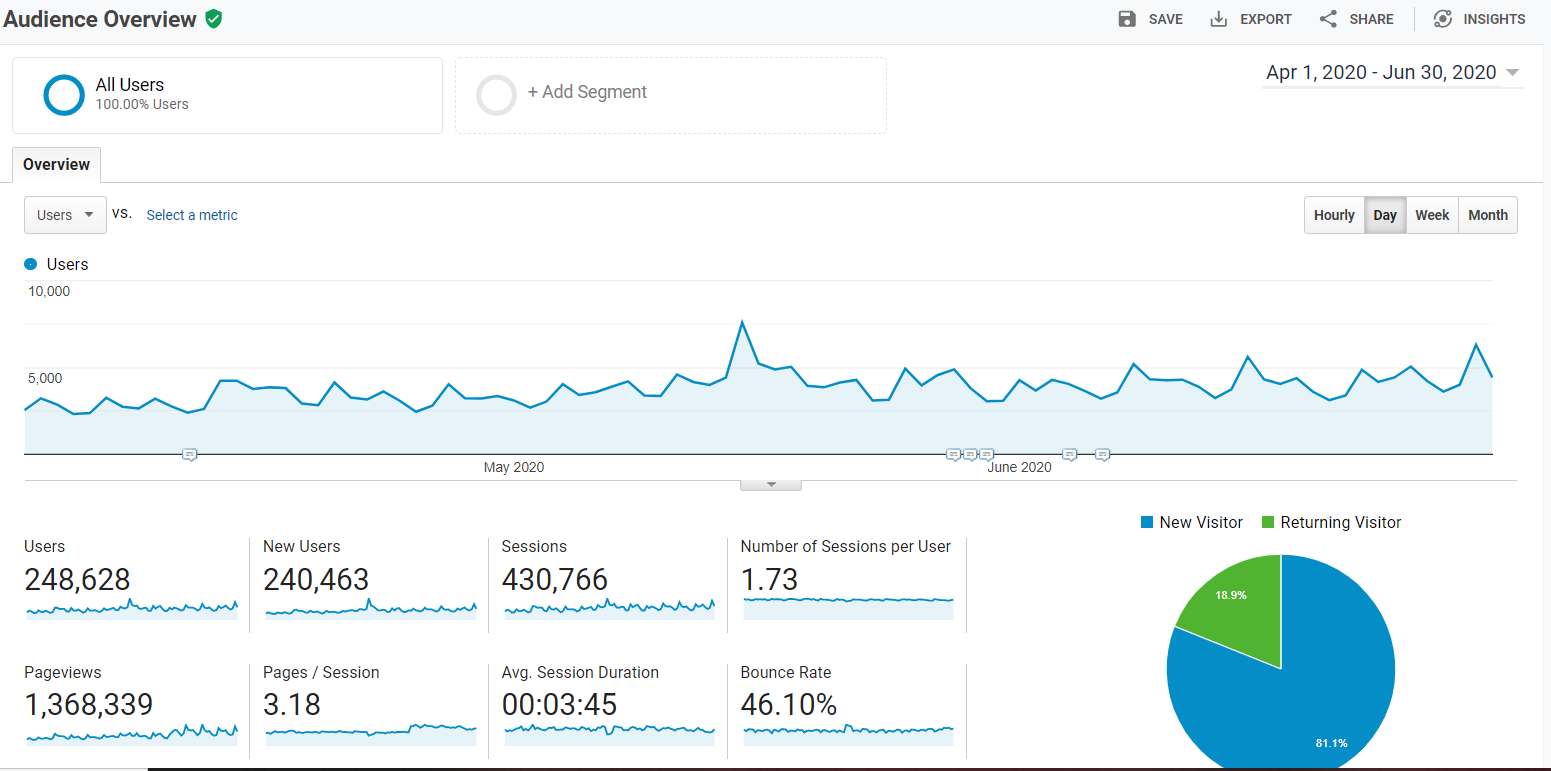
What you’re seeing above are actually some fairly significant gains. Take a look at Q2 analytics compared to what happened in Q1 2020:
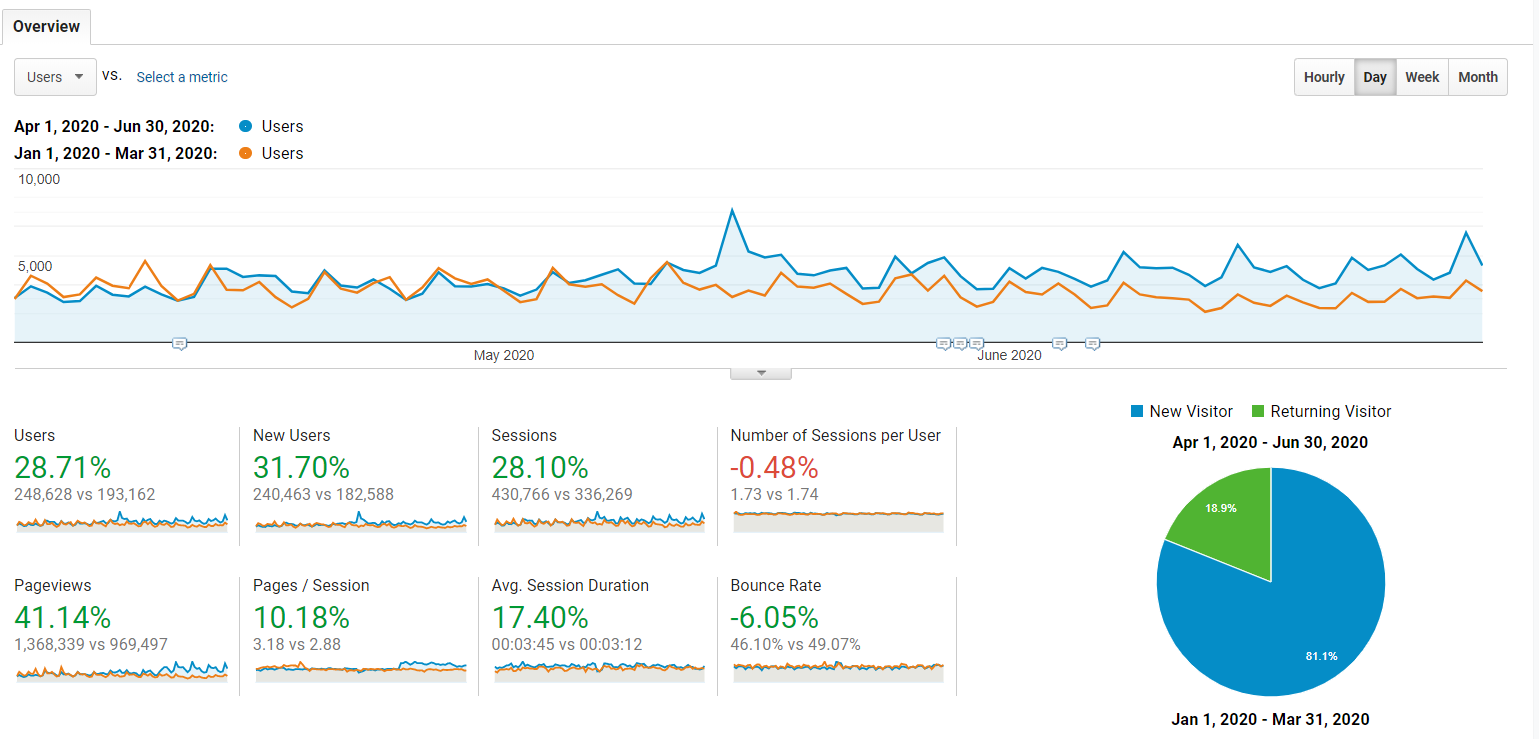
We saw a 29.71% increase in users in aggregate, with a 31.70% increase of new users versus the previous quarter. While our number of sessions did slightly go down, the overall traffic boomed, and sessions in general were up significantly. More importantly, our average session duration has gone up showing that combined with a lower bounce rate, all of this has been fantastic for us from an SEO (and business) perspective.
A big part of this increase is how we now do pagination on our marketplace. Whenever someone chooses a specific monetization to look at, they are taken to an individual page URL slug. The URL slug itself is optimized for that business model and thus that section of the marketplace begins to rank organically for terms around selling those specific business models.
Some of the big winners were our Amazon FBA businesses for sale and affiliate sites for sale pages.
Here are our top referring channels:
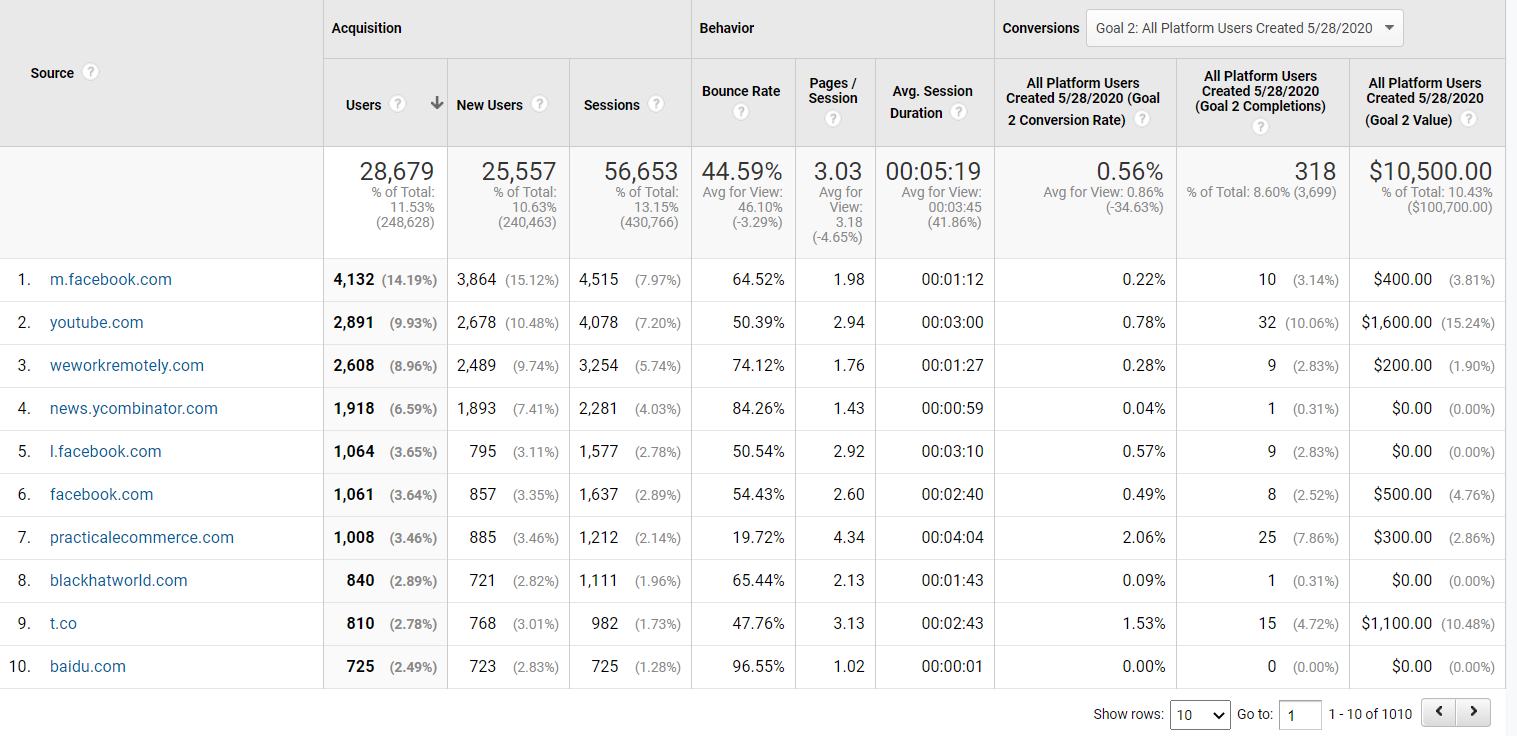
Facebook remains our top referrer, followed at a distant second by YouTube. Though, we’re hoping to change that, which is something we’ll get into later on in this report.
We saw a ton of attention go to the chat specialist role we hired for last quarter. This is the second time we’re hiring for that position and the second time the job posting has received so much action. It would appear we’ve stumbled upon a viral formula there, which has overwhelmed our Operations Director, Andy Allaway, with literally hundreds of applicants. (One of those good problems to have!)
If you’re interested in working with us, check out our careers board for when we post more open positions.
While we’re thrilled about the number of applicants, it can make our analytics sometimes look a little stranger than normal.
It was great to see that YouTube actually increased in how much referral traffic we got in Q2 versus Q1 by 7.35%. One of our SaaS articles listed below also went semi-viral, which led to a whopping 6,087% increase in new users from YCombinator. We always get a bit of traffic from YCombinator, but this article spiked the traffic in a big way.
In general, almost all of our referral traffic channels went up by double-digit percentages except for Facebook. It is interesting to see Facebook actually went down by about 13%, but as you can see, it is still the winner in raw overall number of users visiting our site.
It is also interesting that Facebook went down as we began to share more posts outside of just our seller interviews.
Below you’ll see our most viewed content across our website in Q2.
Here are our top three most viewed pages:
Here are our top three most viewed listings:
- Listing #44985: One of the 7-figure businesses we mentioned above. This FBA business was created in August 2014 in the electronics niche. It is currently valued at $2,705,978.
- Listing #47384: An advertising and affiliate website in the coupons niche that was created in January 2017. The business is currently valued at $14,295.
- Listing #47844 (SOLD): A special listing we sold that featured a calculator on how much toilet paper you need to survive the pandemic. It was sold for $30,002.
Here are our top three most viewed pieces of content:
- How to Start an Amazon FBA Business
- SaaS Pricing Models and How They Affect Valuations
- The Most Popular Online Business Models
Here are our top three most viewed recent pieces of content:
- SaaS Pricing Models and How They Affect Valuations
- How SaaS Valuations Work: Multiples, Metrics, and MRR
- How to Make $50k, $100k, or $500k Online
Podcasts and Shows
Podcasts remain one of our favorite mediums to produce content in. We have three main shows that we produce:
Across all three of our shows we generated 44,146 downloads for Q2. Let’s look at each show individually for a deeper analysis.
The Empire Flippers Show
The Empire Flippers Show is our flagship podcast and the longest-running. Our co-founders, Joe Magnotti and Justin Cooke, get together and do long-form interviews with successful entrepreneurs in the digital space, or they get together to discuss their inside knowledge on the industry as a whole and where things are going.
Here are our downloads in Q2:
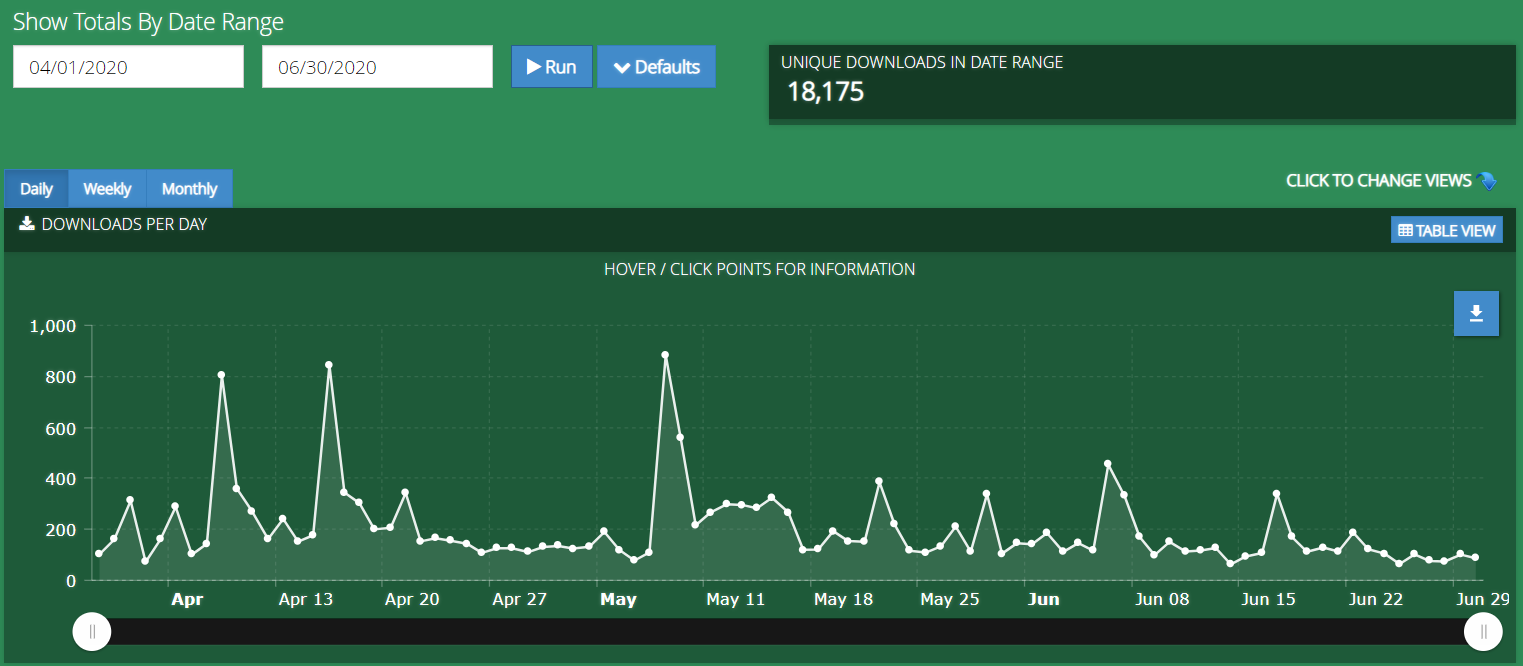
We started the quarter off strong as we released almost back to back new episodes for the first half of the quarter. The new releases began to slow down towards the end, which led to the drop you’re seeing above.
In total we had 18,175 downloads of the podcast in Q2. This is down significantly from Q1, where we had 88,163 downloads. But, as we said in our last Q report, we’re fairly sure something spammy happened there, which caused the majority of the downloads. We’re more confident that Q2 downloads are a reflection of genuine listeners.
Here are our top three most listened to episodes for the quarter:
- EFP 200: Empire Flippers Values
- EFP 199: Creating Your Content Marketing Strategy
- EFP 198: Outsourcing and Management with Mads Singers
The Web Equity Show
The Web Equity Show is a collaboration between our Justin Cooke (our co-founder) and Ace Chapman. Usually, the show is done in seasons focusing on one central theme. The season model holds true all the way up to Season 5 where we switch the format a little and have Justin and Ace speaking about more timely events that are happening.
Here’s our downloads in Q2:

We saw 10,019 downloads in Q2. The Season Five episodes came pretty consistently throughout Q2, and thus saw some good consistent spikes in downloads as each new episode aired. The timely format of the show also likely helped revive interest in the show, including its backlog of episodes across the five seasons.
Because of the boost in promotion for the show created by interest in the new episodes published,, we saw a little bump in total downloads compared to the 9,416 Q1 downloads.
Here are our top three most listened to episodes for the quarter:
Real Money Real Business (RMRB)
RMRB remains our most consistent show over the last two quarters, and that consistency is paying off with extra downloads. In Q2 we saw 15,862 downloads which is up from Q1 when we first introduced the more frequent publishing format and achieved 10,426 downloads.
RMRB is a show focused 100% on people selling their businesses on our marketplace. It provides a window for you to understand who the seller is, what their business is about, and whether you as a buyer would enjoy working with that seller. In addition to being an excellent tool for our buyers, it can also be an inspirational show for those seeking to build out digital assets and eventually exit the business.
Here’s our downloads in Q2:

RMRB is consistently pulling in results for us and is by far the podcast we publish on the most. Definitely give it a listen, and subscribe if you enjoy the content. If you are a buyer, you can also find all of our seller interviews on our marketplace, and even get updates when a seller interview is published on a listing when you register for a free account here.
Here are our top three most listened to episodes for the quarter:
- RMRB 151: Building a $700k Dropshipping Business Selling Bad-Ass Aftermarket Parts
- RMRB 149: Becoming a Millionaire Through Building a SaaS Business
- RMRB 148: Leveraging a Strong Backlink Profile to Build a $200k Amazon Associates Business
Email and Contacts
Email remains one of our most important traffic channels in both generating new leads for our sales team as well as nurturing various contacts to see us as the best possible solution when it comes to buying or selling digital assets.
We have fine-tuned our automation on the seller side and often get automatic seller submissions who decide to sell their business with us. These automated sequences also help to warm up our leads so when our sales team does call them, they are usually happy to chat with us about their options when it comes to selling or buying digital assets.
In Q2, we generated 10,109 new subscribers to our email list, which is up from Q1 where we generated 5,848 subscribers. In a span of just three months we almost doubled our subscribers.
Here is a chart of our subscriber growth in Q2:
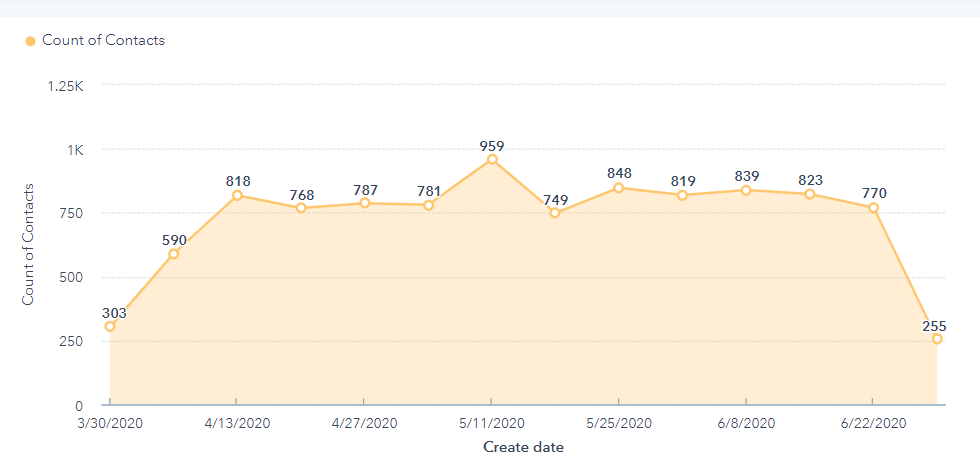
The start and the end of the chart are mainly lower mainly because those weeks partially fell outside of the quarter.
Here is a look at the same chart with Q1 included with Q2:

As you can see, there was a stark rise at the start of Q2, which steadied out at a much higher consistent subscriber rate.
So, what happened here?
A few things transpired. First, throughout Q1 the world was on the brink of global hysteria as the coronavirus spread indiscriminately across borders and oceans. In general, people had other things on their mind than checking out our blog or subscribing to our newsletter. Despite the hysteria though, our subscriber rate wasn’t that far down in Q1 2020 from Q4 2019 in which we generated 5,269 new subscribers, which has always been fairly consistent for us as far as quarterly numbers go.
In fact, Q1 saw the subscriber numbers rise a small amount by a few hundred subscribers.
The story here is that towards the end of Q1 we rolled out the new website and marketplace design, which is where the start of the uptick came in terms of subscribers, fighting against the overall lower conversion rates likely due to the pandemic hysteria.
As Q2 continued and the world came somewhat to an understanding of the “new normal”, our website redesign helped our lead gen game shoot through the roof. We redesigned our marketplace to act as one gigantic lead magnet in many ways. In addition, rallying the majority of our efforts around getting people to sign up for their free Empire Flippers account.
Along with our increased conversion rate and focused efforts, we also saw the huge rise in organic traffic that I mentioned above. Plus, with the “new normal” firmly adopted by many buyers, our marketplace came roaring back to life, getting deals done and seeing the appearance of even more interest from new investors.
All of this went in our favor to produce the most subscribers we’ve ever gained in a single quarter in the history of our company.
Here’s our list size growth over the past three years:

Usually, we show you our list size growth over all time in these reports. And, those graphs almost barely show any kind of real growth at all. Well, while we may be limited to showing only three years of data with HubSpot’s reporting function, this time you can see a nice gentle slope going upwards that represents our success in Q2.
Customer Experience
Customer experience remains a paramount focus of ours, and we’re consistently trying to improve both the actual user experience and the speed of helping our buyers and sellers get a deal done.
While our operations team does a fantastic job in general of helping our customers, and our sales team approaches each conversation as helpful consultants, it doesn’t mean we aren’t still focused on attempting to improve this experience.
Let’s take a look at some of the most common feedback we got in Q2.
Customer Feedback
Every quarter we look at what we did and see how we can improve upon what was done. As new systems are created, rolled out, and implemented, improvement usually becomes about small tweaks and iterations on things we know are already working effectively.
Our customer experience in Q2 is similar to that of the last couple years, which has been overwhelmingly positive.
However, selling a business is always an emotional experience, same with buying one. It is not like buying a coffee at your local cafe; there is a lot of thought and heart that often goes into each transaction we do. This, of course, will mean we will always have some bad feedback.
Here’s a look at our customer feedback:


For the most part, our bad feedback is usually related to someone that has gone through our vetting process and didn’t like the valuation we gave them. We are always honest when it comes to what we believe your business is going to sell for, and many entrepreneurs think their business is worth more as they often have what we call “emotional equity” in the business.
Often it is the first business they have built, and it represents far more value to them personally than what an investor would give it objectively. Since we’re trying to sell your business, we go the objective route of what the market is really willing to pay for the digital asset.
Q3 will be no different than Q2 and previous quarters in that we will continue to improve, iterate, and tweak our customer process to provide you with the most streamlined service as possible to help you make a potentially life-changing decision—whether it be a lucrative exit or acquiring a highly profitable asset.
What Happened in Q2 of 2020?
While conferences were on pause, we certainly still had a lot that transpired in Q2. It was a busy quarter across all departments, and we were able to accomplish some great milestones and come together to focus on certain KPIs with renewed vigor.
Let’s dive into what went down in Q2.
More Data-Driven Content Published
Our content team grew in Q1 and really began to flow, along with the rest of the marketing team in Q2. One of our big marketing focuses is to use the data that we can collect at Empire Flippers to publish more interesting and unique pieces of content that might be of interest to our audience.
I’ve mentioned a few of them previously (i.e., our various ROI studies), but here is a list of all of our recent data-driven posts that you can check out at your leisure:
- Selling Online Businesses – Marketplace Trends for the Past 3 Years
- Lesser Known Digital Assets: An ROI Study
- Does Niche Matter in Online Business?
- Do Older Businesses Sell for More?
- Buy, Fix, Flip Study
- What is the Return on Investment for Buying an Amazon FBA Business?
- Our Data Driven Content ROI Study – What Happens After a Buyer Buys?
In addition to the data-driven content, we also recently published an entire article that explains how VAT works. We found that some of our buyers looking to acquire Amazon FBA businesses operating in the UK and other international markets didn’t know how VAT actually worked. We published this article explaining and breaking down VAT and its implications so buyers can be more aware of whether they want to proceed with a VAT-based business before getting too deep into their due diligence.
You can read our article on how VAT works here.
Also, we did a great piece showing exactly how you can navigate our marketplace even faster to find your perfect acquisition targets. If you’re looking to buy and want to save some time by using our various marketplace features, then check out this article.
We have even more data pieces in the pipeline, but if you’d like us to look at a certain type of data that we have access to for a content piece, then leave a comment below with your idea.
The New Unlock System with Verified Liquidity
We mentioned that our marketplace redesign and the introduction of signing people up for free Empire Flippers accounts helped us focus our efforts on lead generation in a big way. Well, we also changed how our old deposit process worked.
Before, we would have you put a certain amount of money down or credit on file with us to look at a business. The deposit was always refunded, even if you did buy the business. But, we decided to make this process easier for you with our new unlock system.
Instead of putting money down to look at each individual online business for sale, we have you verify your liquidity within our marketplace once you’re logged in. This verification can happen in a few different ways, using either proof of funds in a bank account, stock portfolio, HELOCs, or most other common financial instruments that people use. Once you have been verified, which can take less than 24 hours to do, you are given five unlocks and the ability to unlock businesses priced at 1.5x your verified liquidity..
Don’t be afraid to use all five of these unlocks as quickly as you like. We limit the amount of unlocks just to make sure you aren’t doing anything shady by unlocking dozens of businesses in a single day. When you’ve used all five of your first batch of unlocks, all you have to do to get more is schedule a call with us or reach out to us on our chat support when you next log in to your marketplace account.
We’re happy to give you as many unlocks as you need, so you never have to worry about running out.
Creating a More Streamline Experience for Sub $50k and Now Sub $75k
As our marketplace’s functionality has increased, so has our ability for our buyers and sellers to work with each other to get deals done. One thing we have noticed more and more is that deals beneath $100k often do not need one of our business analysts ever present to get the actual deal done.
Instead, most of the time buyers and sellers are able to work out the details of the deal quite easily amongst themselves. And, most businesses in the sub $100k range tend to almost always sell for list price or right under the list price with minimal negotiations. If someone tries to do a long earn out in the sub $100k range, usually they’re going to be beaten out by a buyer that is more cashed up and can just pay the full list price.
Because of the nature of these deals, we’ve been able to use our various automation processes designed by our engineering team to allow a more seamless communication between buyer and seller. Effectively, this means our business analysts only step in to help with the deal on an as-needed basis.
We debated for a while what the threshold should be to test out this new process of ours, and we began in Q2 by using it on sub $50k businesses. While we recognize that all of the sub $100k sales could likely be streamlined this way, we wanted to test it on the smaller pricing points first. After testing this process for all of Q2 and seeing success, we now feel comfortable raising the threshold to that next level of businesses valued at $75k or lower. We’ll be testing at this price range for the rest of Q3 with the intent to eventually do all sub $100k deals this way on our marketplace.
Using this process frees up our sales team’s time to focus on bigger and usually much more complex deals that need their attention without actually sacrificing any of the perks sellers and buyers get from using us. When the sales teams are needed in a particular deal, they can easily step in and see the communication between the buyer and seller to help out both parties. The buyer and sellers still get to use our legal team and templates, leverage our marketplace in terms of sheer number of investors and deal flow, and access a slew of other benefits that they couldn’t have gotten on their own.
We’re excited to see where this process will lead and even more excited that it is helping our buyers and sellers get deals done more quickly.

Lowered Our Commissions on the High End
Whenever we are attempting to move beyond a certain price threshold, there is always a bit of friction. In our first couple of years we hadn’t sold a single seven-figure business due to a myriad of reasons, such as us not thinking we could sell one, and sellers thinking we couldn’t either because we had never sold one.
Our first seven-figure business that we sold took us close to eight months to pull off.
The moment we sold it, though, a floodgate opened.
We started listing more and more multimillion-dollar businesses. Instead of taking eight months to sell, some of these businesses sold within just one month of being live on our marketplace. Soon, we became an “old hand” at selling businesses this size. And now, we’re moving up to that next price threshold.
In Q2 we listed our first eight-figure business. One way we were able to convince these sellers to list with us was by lowering our commission to attract them to take a gamble on using us. Our theory is that we can sell eight-figure businesses even easier than seven-figure businesses.
The key is to make sellers realize that our process is actually superior to others in the industry.
In order to entice sellers of eight-figure businesses, we are currently offering to sell any business over a $10 million price range with a low commission rate of 2% of the sales price. If you’ve been on the fence of selling your eight-figure business, there is now even less risk for you with a potential for a much larger payout than ever before when you decide to sell with us.
Here is our up-to-date commission structure as of Q2 2020:
- 2% for any business above a $10 million list price
- 5% for any business between a $5 million and $10 million list price
- 8% for any businesses between a $2 million and $5 million list price
- 12% for any business between a $1 million and $2 million list price
- 15% for any business under a $1 million list price
There has never been a better time to sell on our marketplace than today, so if you’re looking for a lucrative exit, definitely consider us or give us a call to help you with your exit planning. These kinds of calls can not only help you sell your business—even if you don’t sell with us, but in general they can make your business more streamlined and profitable.
Published an Educational YouTube Channel
We’ve been wanting to dive into YouTube for a LONG time. The truth is, many of those YouTubers you love watching every day make it look a whole lot easier than it actually is. I’ve personally spent hours filming footage that was simply unusable, and almost every time it felt unusable for a different—though equally annoying—reason.
However, in Q2 we pushed through these trials and finally published our first three videos towards the end of the quarter.
This YouTube channel differs from our main one in that we will only be publishing educational videos made for YouTube rather than uploading podcasts, sellers’ interviews, and other speeches we give over time.
Right now, it is just me (the director of marketing) on there, but our hope is to eventually have more people at Empire Flippers doing videos so you can meet all the talented individuals working behind the scenes to help you make your next dream deal come true.
You can check out our new YouTube channel here.
Here are our first two videos (I didn’t include the third, because my boom mic audio wasn’t working as well as I thought it was):
How to Act Like Private Equity with Your Marketing Agency
How to Become a Digital Nomad Fast (My 3 Methods)
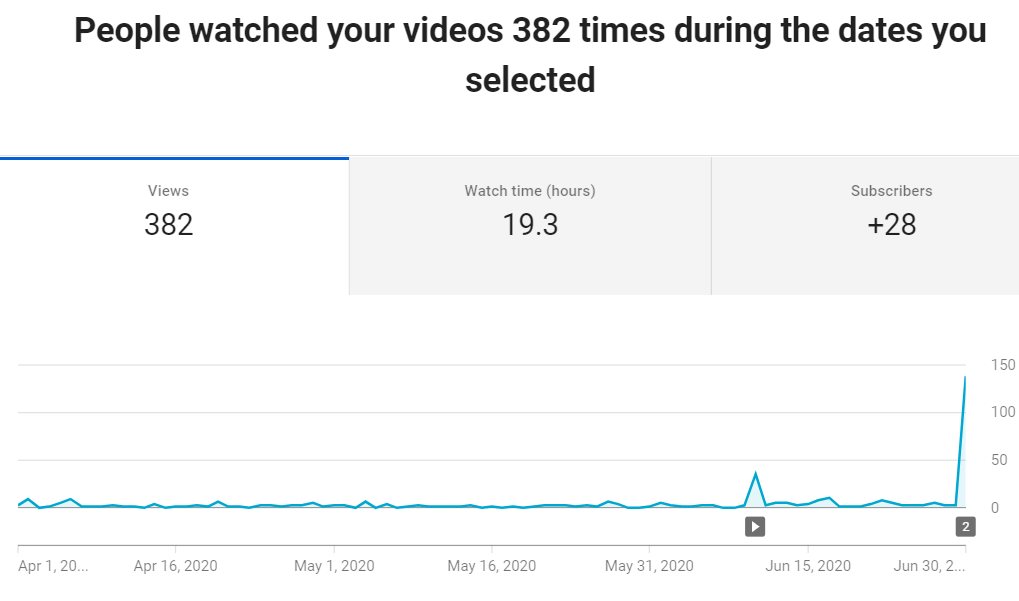
You can see the majority of our views happened at the end of the quarter, and this is because the two videos I’ve linked above were published almost exactly at the end of the quarter.
Over time, our YouTube analytics should become a lot more interesting, and we’ll keep reporting on it in our quarterly reports.
Launched an Educational Portal Inside Your Empire Flippers Account
If you’re brand new to buying or selling digital assets, you may feel overwhelmed about what you should be learning and how the process works in general. We get that the information can feel a little “all over the place”.
In an effort to help you out, we’ve launched an educational portal featuring all of our downloadable lead magnets, white papers, case studies, and other curated content for you in one place when you login to your account.
All you do is click on either “Buyer” or “Seller” in your account, and within that dashboard, simply click “Resources” and you’ll be greeted with the buyer or seller page featuring our resources like this:
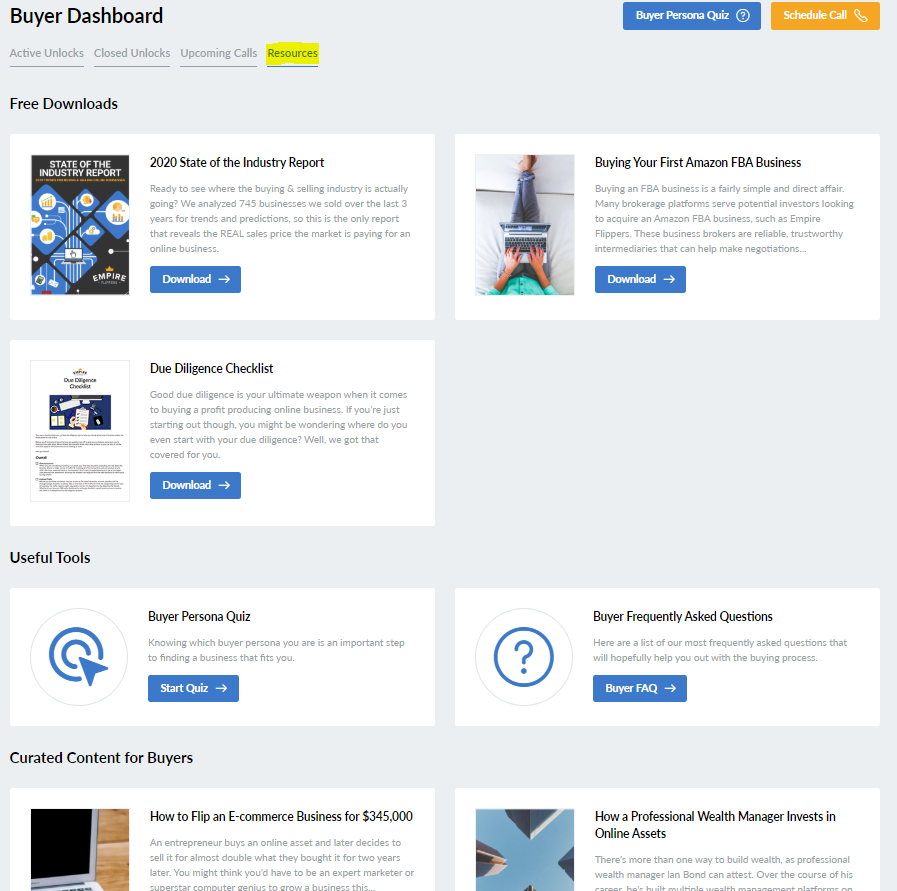
We’ll be keeping these resource pages updated as we create new content in the future to help make the buying or selling process easier for you.
Revamped Our Valuation Tool
In Q2 we worked hard to update our valuation tool, which can give you an automated ballpark estimation of what your business is actually worth.
While these valuations won’t be as accurate as actually going through our vetting process, they can give you a solid idea of just how much your business could be sold for on our marketplace. The tool is now using all up-to-date information from actual sales data of real businesses being sold on our marketplace.
Our industry can change fast, so we’ve decided to take a look at our valuation tool formula every quarter to make sure we’re still providing the most accurate estimations possible using what we see happening in the industry and where we believe the industry is going.
In particular, one monetization that sorely needed updating was our SaaS valuations. SaaS was not a focus on our marketplace for a long time, and our tool reflected that with the estimations it would give. Now, it has been updated, and if you’re a SaaS founder, you can see a much more accurate picture of what your business could sell for if you decide to ditch the VC-style exit in favor of a more traditional (and perhaps more lucrative) exit to private investors.
You can check out and get a free valuation from our tool by clicking here.
And That’s a Wrap!
There you have it.
Q2 2020 was an intense quarter for us with a lot of new record-breaking achievements. We’re not sure if the trend will continue, as the pandemic is still raging around the world at the time of this writing. We’re hoping that the uncertainty in the market is over, but we can never be sure as these are some wild times that seem to defy normal expectations.
Either way, this quarter has proven to us that our business model, and online businesses in general, are particularly resistant to game-changing economic upheaval. In many ways, there has never been a better time to buy or sell an online business.
Now that we’re a few months into the pandemic, you’ll be able to make much better and more informed decisions on your acquisition strategy or exit strategy.
Whether you’re a buyer or a seller, we’ll be there to help you every step of the way.
If you’d like to buy a business with us or look at what’s for sale, make sure to sign up for a free Empire Flippers account.
If you’d like to sell a business with us for a lucrative exit, you can do that here.
Hopefully, your quarter was as good if not better than our own. However, if your quarter went down, we’ll be here rooting for you to reach ever new heights of success and help you in any way we can.
