Lesser Known Digital Assets: An ROI Study
 Updated on June 16, 2020

We’ve completed another return on investment (ROI) data study. Are you ready for the results?
If you’ve been following our recent blog posts, you’ll have noticed that we’ve undertaken a series of data studies on the ROI from digital properties acquired on our marketplace.
Whether you’re new to the world of buying and selling online businesses or a seasoned veteran in the digital acquisition space, the data gathered from our previous study on ROI from content sites and our recently published Amazon FBA ROI study both showed amazing results.
Having already sold more than $100 million in businesses on our redesigned marketplace this year and with over 270 digital properties sold in 2019 (which you can read about in our 2020 latest trends report), we’ve discovered some amazing data and valuable insights into what successful owners do to gain a profitable ROI from their acquisitions.
With this study, our intention is to provide the most helpful information we could find for people looking to invest in a digital property outside of Amazon FBA and content-site monetizations.
We only focused on the ROI for digital properties that are not FBA or content businesses. This includes e-commerce that does not heavily rely on any Amazon related businesses, dropshipping stores, Merch by Amazon and Kindle Direct Publishing (KDP), application, service, subscription, lead generation, software as a service (SaaS), and any other digital product-based monetizations.
Quick 30,000-Foot View of Our Results
During Q1 of 2020, when this study was being conducted, the world was faced with a catastrophic pandemic that has had a huge impact on business owners and employees everywhere. Based on the data we’ve collected, we’ve broken these businesses down into those with stable or growing monthly net profits before the pandemic, those with stable or growing monthly net profits before and during the pandemic, and those who suffered a decline both before the pandemic and as a direct result of the global outbreak.
Here’s a breakdown of what happened:
- 14% increased their ROI (avg. ROI increase of 20%);
- 21% maintained their ROI; and
- 65% saw their ROI decline.
Based on the 23 data-driven interviews conducted for this study, we found the following: nine buyers (39%) experienced stable or growing monthly net profits before and after the economic fallout of the pandemic; four (18%) reported that their monthly net income was stable or growing before they experienced a decline as a direct result of the pandemic; one (4%) saw growth as a result of the pandemic experiencing a decline before the outbreak; and the remaining nine (39%) suffered a decline both before and after the pandemic.

Don’t let these numbers scare you. Again, these percentages are anomalies. They wouldn’t exist in the everyday context of running and maintaining a digital property. There’s not much one can do in the face of a black swan event like this.
All things considered, the businesses that were stable and growing before the pandemic and continued to do so after are huge winners. Those that were stable and growing before the pandemic but have now suffered a decline could still produce great ROI once normalcy returns and they get a chance to rebound.
Meanwhile, the popularity of FBA and content businesses is clear. As an investor, when you have an interest that popular, you might wonder why you’d bother choosing anything else. Well, let’s dive into a few good reasons to buy one of these lesser known monetization opportunities.
And before you say it in the comments, we know that non-Amazon e-commerce stores and SaaS are pretty popular as a whole, but we had so little data that we grouped them into this ROI study. Over time, this will likely change as we gain more feedback from the traditional e-commerce stores and SaaS owners who sell their businesses with us.
What Data Did We Collect from Buyers of Lesser Known Businesses?
As in our previous data-driven studies, we gathered all monetized assets acquired on our marketplace and compiled them into one sheet, except this time we left out data related to content sites and FBA buyers. After that, we further refined the list to include only business owners who’d owned their assets for at least six months and up to two years at the time of the study.
After including these restrictions, we had a total of 142 businesses that were non-FBA, were unrelated to content sites, and whose buyers owned their asset for 6–24 months. We then reached out to see if these buyers wanted to participate in our data-driven study. We received 23 interested responses.
Our Data
We asked our 23 respondents
- if they were first-time buyers,
- what they were looking for before making their acquisition,
- what their desired niche was,
- what their status was (whether their business had grown, stayed consistent, or declined),
- how much their asset had grown or declined (as a percentage),
- what their top strategy was for growing the business during their due diligence,
- if they made any major changes after the acquisition, and
- what their future business goals were.
Based on the data generated by these questions, we were able to further understand what led to the outcomes these business owners experienced and what they’d been doing on their backends.
Before we dig into what changes respondents made to their businesses and how those changes increased or decreased their average monthly net profits, we should first look at what types of buyers purchase these monetizations.
So What Exactly Were Respondents Looking for in a Business?
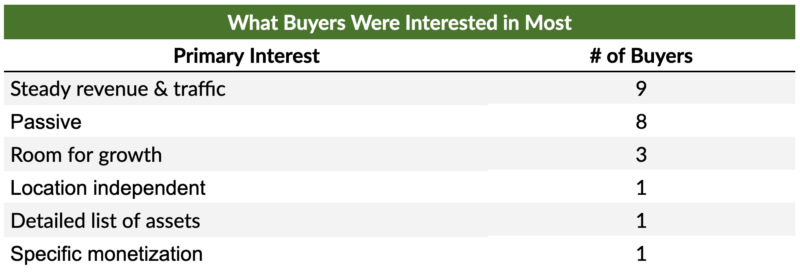
Thirty-nine percent of respondents claimed to be most interested in steady growth in traffic and revenue. Another 35% said they were driven to acquire something more passive than their other holdings, while 14% indicated that they were looking for something with room for growth and something that wasn’t overly optimized. The last 12% were looking for something location independent that came with a detailed list of assets included in the sale, and one buyer was looking for a specific monetization to add to their portfolio. We call these types of buyers Strategic Sally’s in our different buyer personas.
As with our previous two studies, discussing which niches performed well over the past two years is an interesting exercise. As we’ve mentioned time and time again, niche selection does not always make the difference in a business’s success.
Below, we’ve provided a figure illustrating the span of various niches in this study that showed net profit growth and decline. That said, these are so-called “parent” niches; we’re not revealing any actual niches in order to maintain client confidentiality.
Niches that Were Stable or Grew Before and During the Pandemic

As the figure above shows, the technology, home, news and education, travel, books, automotive, and SEO niches all played a role in providing great niche opportunities for respondents over the past two years. That doesn’t mean you should only focus on these niches when deciding which one you’ll target in your new acquisition, but it does give you an idea of what evergreen niches look like even in time of volatility.
Furthermore, as you’ll see below, some of the growing niches also suffered a decline in monthly net profits. This leads us back to what we always say: a business’s niche isn’t usually an important factor in its growth or decline over time.
Niches that Have Declined

As you can see above, the survival and security, outdoors, entertainment, and baby care niches all experienced a decline in monthly net profits both before and after the impacts of the pandemic. You’ll also notice that, according to their owners, both the technology and apparel and accessories niches experienced a rise and decline in monthly net profits within this study.
With no real evidence on what the perfect niche was for these monetizations over the past two years, let’s consider their start-up costs instead. Based on our 2020 industry report, we sold 68 businesses that fell into the “all other” category outside FBA and content sites. In 2019, the average sales multiple for these monetizations was 27.1x. The average asset sales price in this study was $144,508.
So what did respondents change on the back end of these businesses to gain a positive or negative ROI? Let’s dive in and find out.
What These Buyers Changed to Grow or Maintain Net Profits Before and During the Pandemic

Adding New Products and Content
When done right, publishing new content and products can be a powerful strategy, which was the experience of one respondent who purchased their e-commerce business for $47,900 in the technology niche of our marketplace back in 2018. At the time of listing, the business was making around $2,000 per month in net profits. After adding two products to the line, monthly net profits increased by 20%.
Onsite Search Engine Optimization and Conversion Rate Optimization
Aside from adding new products and content, what other improvements did respondents pursue to ramp up growth? If you’re not familiar with search engine optimization (SEO), it’s a tool for growing your website’s traffic by increasing its visibility or ranking on a search engine results page. Meanwhile, conversion rate optimization, as the name suggests, is the optimization of your conversions based on what action it is you want your traffic to perform. This can be anything from signing up to your newsletter or using a discount code for free shipping.
One respondent who purchased a dropshipping business for $30,000 in the home niche in December 2017 capitalized on onsite optimizations. Updating the pictures on the site helped increase page load times, and performing A/B split testing on important calls to action helped with conversions. The respondent was able to scale the asset’s net profits by 25% to generate $1,500 per month on average. Excluding extra costs associated with scaling their marketing efforts, this respondent gained a full ROI in less than two years with a powerful monthly cash flow.
Creating and Optimizing Pay-Per-Click Ad Campaigns
Optimizing a business’s existing advertising campaign is what many digital property investors consider as low-hanging fruit when looking for a quick ROI. One buyer of a $54,000 travel application and AdSense business from our marketplace in 2019 knew the ads needed updating. They discovered an opportunity to optimize the previous owners’ PPC campaign to gain better conversions and margins even while traffic was declining. This allowed them to maintain the previous owner’s monthly net profits.
Adding Additional Monetizations
One respondent saw a great opportunity to add an extra revenue stream to their asset after taking full ownership. They purchased this subscription business for $230,000 in the SEO niche of our marketplace in October 2018, and it was already generating $8,200 per month in net profits, but the buyer knew there was still more room for growth.
They added an e-commerce component to the business model, and from there, they grew the asset to generate $9,800 per month in net profits. That’s a 20% increase from adding this one component to the sales strategy.
What’s also interesting about this particular respondent is that the $230,000 investment they made on our marketplace was their first online business venture. Coming from the real estate industry and being unfamiliar with the online space and how it worked, they wanted to try their hand at growing a digital property. This is what they said about the experience:
Everything was very well organized. I mean, communication between both parties went really well. When I had questions, Empire Flippers responded very quickly. So yeah, really great process overall. I can safely say that if I were in the market to buy another business, Empire Flippers would be the first place I would look.
Respondent
How Three Respondents Were able to Maintain a Business as It Is
We’d love to say that every business on our marketplace can be as passive as these three respondents (13%), but this isn’t always the case.
One respondent was able to continue with what the previous owner was doing when they purchased an Amazon KDP business for $118,000 in the news and education niche in April 2018. The business already had a team of outsourced content writers and publishing contractors, so it was an easy win for this respondent. However, maintaining the business as -is doesn’t always work for everyone.
There are also some changes that can have a negative impact on your average monthly net profits. Let’s find out what those changes might include so you can make sure to optimize what impacts your ROI the most.
Why 18% of These Businesses Only Declined in Monthly Net Profits after the Pandemic

Full Overhaul on the User Interface
A user interface (UI) is anything customer facing. It can be the front-facing website design or the landing pages used to gather your audience’s contact information.
One respondent saw a great opportunity to update the UI of an e-commerce business they purchased for $195,000 in the apparel and accessories niche in 2019. He performed a complete website front-end rebuild and added products to the site. These improvements generated some growth, but due to the nature of e-commerce during the pandemic, the business suffered a decline of 20% because of increased shipping times from its suppliers.
Slimming Down the Product Line to Focus on the Biggest Revenue Drivers
Slimming down the product line was something one respondent did after taking full ownership of a subscription, dropshipping, and e-commerce business in the jewelry niche back in March 2019. The business specialized in hundreds of products spread across many sales channels. After the buyer decided to cut the products that weren’t generating much revenue, margins increased. Unfortunately, pandemic-related shipping delays cropped up at the same time and thus profits decreased.
It’s important to be cautious anytime you remove content from your business. Should you decide to remove content, make sure you research how it’ll affect your asset’s net profits. Additionally, think carefully about the products you’ve cut if your traffic suddenly drops.
Why 39% of These Businesses Lost Profits Before and During The Pandemic

In this section, you’ll see that some of the same changes that drove growth for some respondents in the previous section also led to declines for others. Let’s dig into each of the changes made by those who experienced a decline to see what might have happened.
Excluding Content Can Hurt Your Business
One respondent experienced a decline in monthly net profits both before the pandemic and more so after, when Amazon prevented all Merch owners from uploading new design content. This respondent stopped shipping products completely.
After purchasing the business from our marketplace in February 2019 for $110,000, this owner of an Amazon Merch and dropshipping business in the apparel and accessories niche was making an average of $4,700 a month in net profits. Sales declined as new initiatives from Amazon began to make it harder for Merch sellers to produce fast lead times and upload new designs due to the global impacts of the pandemic, resulting in a decline of 50% in net profits.
This is no fault of the respondent, but it does drive home a point we raise time and time again: it’s always best to diversify your revenue streams as much as you can to avoid these types of problems.
Full Site Overhaul and UI Updating
A full site redesign and UI update was something one SaaS buyer performed on their business shortly after purchasing the asset for $48,000 in 2019. They decided that adding landing pages and updating the website’s front end was the ideal strategy to grow the business to its full potential.
Over time, they began experiencing a decline in monthly net profits from the $1,700 per month it was making to around $170 a month. That’s a drop of 90%, which wouldn’t even cover the respondent’s developer costs. There were a few other back-end issues the respondent didn’t want to get into, but this leads us again to state that any changes made to your customer-facing content should be cross-examined before they go live.
Why Maintaining the Asset Isn’t Always the Best Approach
When one respondent acquired a $55,000 digital product business in the technology niche in December 2018, they were looking to own something passive while they ran a few other side projects. The business was generating $2,500 per month in net profits at the time of acquisition, and after only focusing on maintaining the business while growing their other projects, the respondent’s asset suffered a 90% decline in net profits.
To avoid this same problem on your own digital journey, keep your content fresh and interesting. It’s important if you want to target your audience.
How Changing Your Pricing Structure Could Salvage Your SaaS Business
One respondent purchased their SaaS business in the finance niche knowing that it had a few issues on the back end with its software pricing model. The business was generating an average of over $13,000 a month in net profits and offered a digital service that required the use of a developer. Alas, the respondent wasn’t familiar with programming.
Taking a leap of faith and trusting the work of our dedicated vetting team, the respondent decided to take a chance and optimize the business anyway. They purchased the asset for $645,000 in September 2019 and experienced a decline of almost 50% right from the start because of a faulty payment model that was no longer accepted by their customer payment processing service.
Absorbing this big of a decline before the impact of the pandemic wasn’t something any business owner would’ve wanted to experience. Updating the pricing model and expanding outside the EU has helped this respondent turn things around. Their monthly net profits have been increasing, and things are starting to look positive.
How Can You Gain a Profitable ROI from Similar Investments Made in this Study?
Whether you choose to invest in growing a SaaS, digital product, Amazon merch or KDP, subscription, service, lead generator, or dropshipping business from our marketplace, it’s good to have a goal in mind: what do you hope to achieve with this acquisition?
The respondents in this study told us what their future goals were. Thirty percent stated that improving their site’s SEO would be their primary focus, while 17% said expanding to other marketplaces and branching out to other platforms would be their next moves.
Whatever your business goals are, we hope that by optimizing your asset the way these respondents did, you’ll get the results you’ve been looking for.
If all this talk about gaining a profitable ROI on a recently acquired digital property sounds like an opportunity too good to pass up, schedule a call with one of our business analysts today. If you set up a criteria call with one of our analysts who reviews new businesses every week, we can pair you with an opportunity that meets the requirements of your individual investment goals.
Already have an established business and not sure if now is the best time to sell? Set up an exit planning call, and our team will help you get the best possible ROI from your exit.

