Selling Online Businesses – Marketplace Trends for the Past 3 Years
 June 18, 2020

It’s often said that studying the past helps predict the future.
You can do this for your own online business when forecasting inventory or analyzing your previous marketing campaigns.
Recently, we’ve been looking at the history of our marketplace here at Empire Flippers. We wanted to know if there were any regular trends of online business sales that recurred year after year.
Our marketplace has evolved a lot, gradually taking on bigger and more deals, but growth isn’t always linear.
We looked over the last three years of sales data for 745 business sales, to see if there were any trends in our marketplace. We didn’t go back any further as we were taking much smaller deals at a lower quantity back then.
While we found there was, in fact, no real seasonality throughout the year regarding the sale and purchase of businesses, we discovered how our evolution as a company has impacted our marketplace – and our stats didn’t show a straight diagonal line going up.
2017 – Our First Ever 7-Figure Sale
This is the year we sold our first 7-figure business.
It was a big turning point. We had to change how we operated as a company to continue to deliver great service to these larger businesses. We recruited employees and fine-tuned our processes to achieve this. We’ll talk about the effect it had on our marketplace data in just a moment.
In 2017, we made $19,684,534.29 total in business sales, with an average deal size of $96,932, across 199 sales.
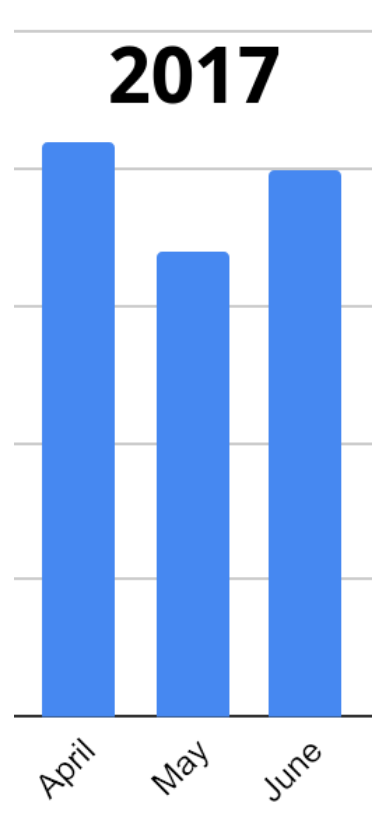
Below is a month-by-month breakdown of how many businesses were sold in our marketplace.

It’s clear that there was no seasonality. The year started off a bit slow, with sales dropping until March, but in April we see a sharp increase of nine business sales.
We’d brought on three sales apprentices toward the end of 2016 that we hoped would help us ramp up sales. We think there was stagnation in Q1 because of the growth of our sales team; we needed to adjust processes and allocate time to training. More than that, we were finalizing larger deals, which took more time, and required us to spend more time growing our connections, relationships, and negotiation skills.
Investing into our sales team paid off in Q2. We were able to communicate with multiple clients at once, and we got our overflow of leads down to a manageable level.
We also had a major overhaul of our operations this quarter. In Q1, we hired customer advisors, which allowed us to implement updated systems into our vetting, customer service, and migrations departments. These changes allowed us to streamline a lot of our processes, which is probably the main reason for our success in Q2.
Another contributing factor was an ask me anything (AMA) we posted on Reddit that got to page 1! It placed eleventh and drove so much traffic to our website that we had to pay extra for our hosting server! This led to a number of fairly big businesses being listed on our marketplace, the effects of which we would see in the next quarter.
On the topic of marketing, we hired four contractors – though one dropped out – to increase content marketing production. We were able to create more articles, seller interviews, and other forms of content to promote our brand. The effects of this infrastructure would be seen later in the year and into early next year.
Sales dropped back down again in July after April, May, and June stayed over the top figure for Q1. This may have been caused by the overflow of leads that our sales team couldn’t keep up with. Our sales team was also attending big industry events, so that slowed things down, too.
August shows another mini-boom, and then September and October show a drop.
In Q3, our Digital Journey Podcast started to get into gear, generating 30 leads.
We experienced a slump in October largely due to what we call “lumpy sales.” This is where we’d sell a bunch of high-value businesses all at once and then need to fill our sales funnel again to start selling others.
The steady growth trend for the final two months of the year is also interesting. A big part of this was simply due to the fact that we were getting our sales team more experienced in both small and large deals, so we were able to sell more.
Overall, there aren’t many statistically significant data trends to report here, so let’s take a look at 2018.
2018 – Commission Changes and Multiple Hiring Rounds
Over 2018, we made $33,004,076.96 total in business sales, with an average deal size of $56,564.40 across 274 businesses sold.
That’s an increase of 75 businesses sold compared to 2017! This provided more data for 2018’s breakdown.

As you can see, this is vastly different from 2017’s breakdown, but we can explain.
We sold our first 7-figure business in 2017, which led us to a transition period. We were developing our processes to accommodate bigger deals, but we were also developing our sales pipeline of buyers and sellers to make the deals happen.
The above graph shows that, during the first few months in the year, sales were a bit choppy. They started to even out as the year went by.
Q1 was the biggest quarter we’d ever had: our commitment to developing our team, eliminating bottlenecks, and refining our processes the previous year had started to pay off in a big way.
This allowed us to reap the rewards of increased deal flow. The ability to do more deals got us over the hump, as our average deal size did not increase much from the previous quarter.
Changing our commission structure, something we just did once more to attract higher end businesses to the marketplace, also had a big impact on Q1 and Q2. We previously charged a flat 15% for all businesses, but found that charging a lower percentage for larger businesses made more sense from a business standpoint. This would have attracted more large businesses to our marketplace back then, as the new changes are now doing.
In Q1 of 2018, we sought to improve our processes even more by removing one of our biggest bottlenecks: vetting.
Pre-2018, vetting was run by one person, which limited how many businesses we could push live on our marketplace every week. The workload became too much for one person to handle, and the waiting list of business owners looking to sell their businesses with us was becoming too large.
We added four new people to the vetting team in January, which helped us see that we could at least keep up with how many new business submissions we were getting on a weekly basis. We had also trained the four extra business analysts we’d hired in Q4 of 2017 to help us get more businesses on our marketplace and to sell more businesses.
In the first few weeks of Q1, we launched over 10 new listings almost every week, considerably shortening the waiting list of businesses that wanted to go live on our marketplace.
In Q2, we hired people for our sales, marketing, and migration teams, so this likely helped steady and increase our sales rate, too.
Another mini boom is also seen around tax season. The data show a similar pattern to that of Spring 2017.

We could attribute this to buyers wanting to purchase businesses for tax reasons, but there’s no real way to know for sure without conducting a buyer survey.
In Q3, we had really got our processes down and filled up our pipeline a bit more, so things started to steady. We’d also hired new vetting specialists, business analysts, and a new customer service advisor, the effects of which can be seen in Q4 of 2018 and Q1 of 2019.
In the final quarter for the year, we accepted the most 7-figure businesses we’ve ever had to our marketplace. This may explain why the volume of sales dropped, as it took up a bit more of our resources to get bigger businesses listed.
Overall, 2018 was a much steadier year compared to previous years. Let’s see what 2019 had in store.
2019 – Private Equity Firms Appear on the EF Marketplace
In 2019, we’d made $14,875,873.23 total in business sales, with an average deal size of $252,133.44 across 273 sales.
That’s a decrease of just one deal compared to the previous year. We missed our end-of-year goal by just 1%!

As you can see, the drop in sales that began at the end of 2018 continued into the start of 2019.
We attributed this to the hiring spurt we had in mid-2018. If you scale a company up too quickly, you’re going to run into many inefficient operations. The same operational procedures that work great with a small team don’t work as well when you scale. That’s why we decided to have a hiring freeze in 2019; we needed to buckle down and increase our efficiency using technology and by revamping old processes.
By February, we were back on track. We experienced our highest average weekly seller submissions for the quarter at 27. We also had our most seller submissions in a single week at 45.
This early success can be largely attributed to introducing the “Seller Pod.” This section of our sales team is 100% focused on answering sellers’ questions before listing their business for sale.
Although there was quite a drop in sales volume in Q2, we made the most revenue ever that quarter due to larger deal sizes.
Updating our marketing funnels during the first two quarters also had an effect on sales. It included reworking all of our emails funnels, writing onboarding articles, implementing a marketing qualified leads (MQL) system to help the sales team, and making our blog more user-friendly.
The fruits of our labor would come in Q3.
During this quarter, we launched the new marketplace. Through it, buyers were able to filter searches a lot more efficiently for businesses, saving them hours when trying to find their next investment.
Our blog redesign was also launched, enabling site users to find helpful articles more easily, which no doubt would have had an impact on conversions and, therefore, business sales.
Leading up to the end of the year, we removed most of our email funnels completely and created brand new email sequences to match the most up-to-date structure of the company. We feel this might have played a part in our increase in sales in December by increasing the number of seller submissions and verified buyer unlocks.
Despite vowing not to hire in 2019, business needs forced our hand. We had too many sellers submitting their businesses for our marketplace, and we had to hire to handle the volume. We took on three new members for the vetting team, another for the migrations team, and two for the marketing team.
2019 was another breakthrough year for us: we listed our first 8-figure business. This caught the eyes of private equity firms and high net worth investors who contacted us to broker deals for online asset acquisitions, which will no doubt help take our marketplace to the next level in the near future.
Overall Findings
As with all studies, there are some limitations affecting the results. How we operate the marketplace and our back-end procedures have both changed a lot over the years.
For example, our marketing team’s efforts and marketplace usability influenced how many sellers submitted their businesses for sale, the capacity of our team influenced how many businesses we were able to get onto our marketplace, and our marketing and sales efforts influenced how many buyers we had in our pipeline to get those businesses sold.
Those are not all of the factors that came into play, either. We attended conferences, released our valuation tool, were featured on big media outlets like CNBC and Forbes, and more that impacted the state of our market.
Looking over the past three years of data, there doesn’t seem to be any crystal-clear seasonality or recurring trends in our marketplace.
We’ve refined our processes to make selling your online business a seamless, efficient experience.
Our pool of buyers grows every year and, with the diversity of buyer types expanding, it gives you a higher chance of selling on our marketplace.
What Does the Future Hold for the EF Marketplace?
Of course, these are uncertain times as a recession is potentially looming due to the pandemic.
However, our marketplace is still very much active. In fact, last month was our biggest ever breaking $10,000,000 in sales. We’ve still got a pipeline full of keen buyers and we’re working harder than ever to keep our marketplace growing.
As for what the future holds, it’s honestly hard to say. We have our goals to reach and plans on how we can keep the marketplace going at its current pace, and we’ll continue to work towards them.
The data for this year will be massively skewed compared to previous years, but we’ll keep tracking everything we do to provide helpful information to our buyers and sellers.
It’s still a good time to sell, with many buyers looking for investment opportunities.
If this article has helped you come closer to a decision to sell, then reach out to our friendly sales team who can guide you through the process.
Or, if you want to see what your business is worth, then try out our valuation tool.
And, as always, please feel free to ask questions below – we’ll be happy to answer.

