Our Q3 2017 Business Report – July, August, and September 2017
 Updated on February 29, 2020

It is that time of year again: Quarterly report season!
2017 has been a crazy ride, and Q3 has been no different in that regard. While we didn’t beat out our Q2 numbers, Q3 is the second strongest quarter our company has ever had. This is encouraging due to the fact that Q3 is often a “slump” quarter for businesses, thanks to the summer holidays people tend to go on.
Already, the future looks pretty bright for Q4 as well—but you’ll have to wait for that report!
Before we dive into the events that unfolded in Q3, let’s look at the numbers.
Executive Summary – Q3 2017 Report
As I mentioned, Q2 was our largest quarter ever, but Q3 came in at a close second..
Here’s a look at our deals for the quarter:

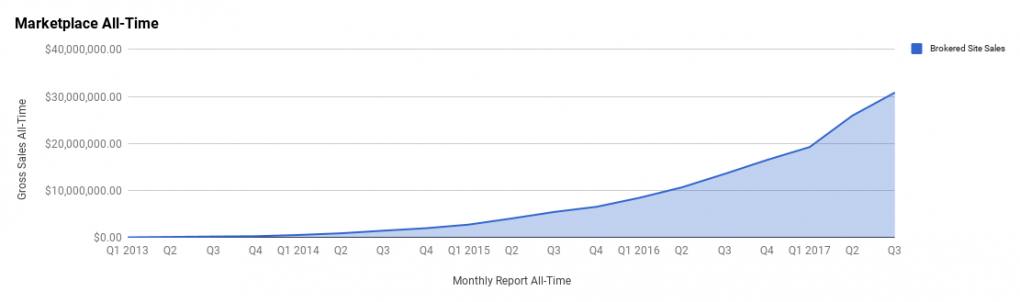
Here’s a look at our marketplace all-time:
Q3 2017
Business Data:
- Total Team: 27
- Customer Heroes: 12
- Management: 6
- Business Advisors: 3
- Marketing: 1
- Apprentices: 0
- Contractors: 5
- Email Subscribers: 42,835
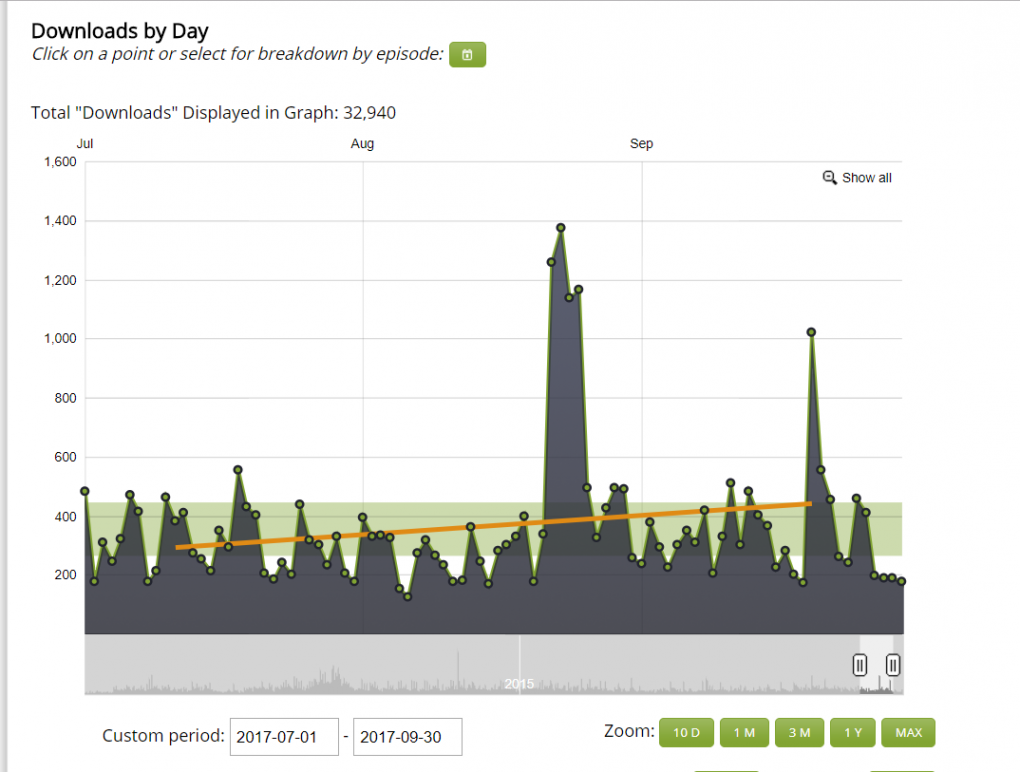
- Podcast Downloads: 43,902
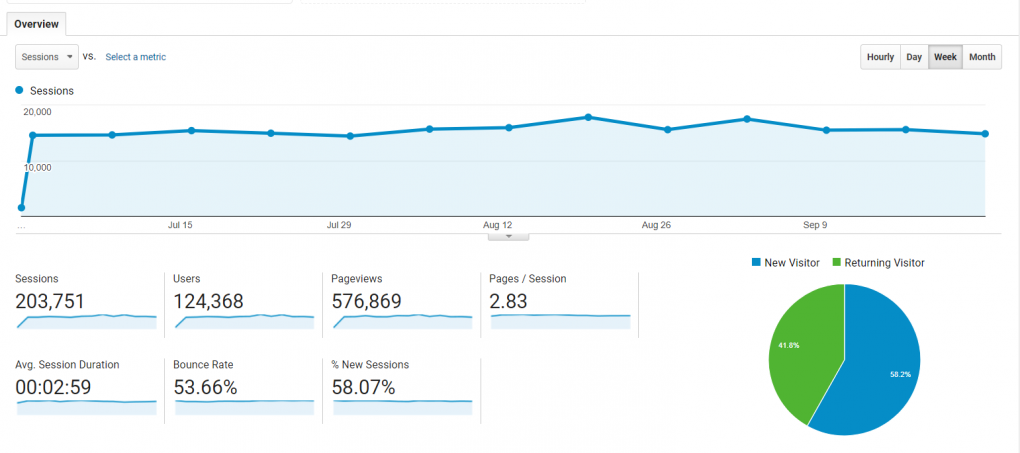
- Site Visits: 203,751
Revenue:
- Brokered Site Sales: $4,933,961.24
- Listing Fees: $8,898.00
- Investor Program Raised: $0.00
- Investor Program Overall Earnings: $6,717.02
- Average Deal Size: $93,093.61
Total Revenue: $4,949,662.56
Earnings:
- Brokered Site Earnings: $636,743.12
- Listing Fees: $8,898.00
- Investor Program EF Earnings: $0
- Additional Revenue: $86.30
Total Gross Earnings: $645,727.42
Revenue Breakdown
Alright, that is A LOT of numbers. And there is an interesting story behind those numbers, so let’s break them down and talk about what they actually mean for us.
Brokered Site Revenue
We brokered 53 deals in Q3 for $4,933,961.24.
That puts our total all-time revenue at $30,848,661.16.
Unfortunately, our average deal size fell this quarter from $115,103.62 to $93,093.61.
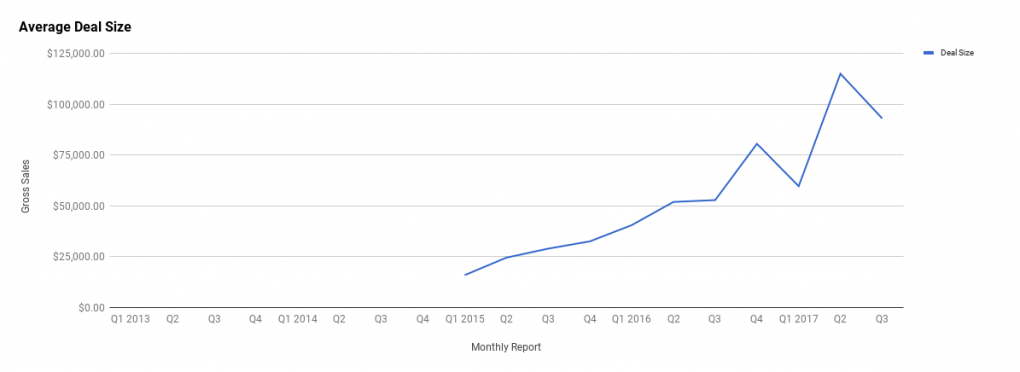
The reasoning? It is likely because last quarter’s numbers were skewed when we sold our $1.7 million Amazon FBA deal. That was our first seven-figure deal, but it won’t be the last big deal to skew some of our quarterly numbers.
After we wrote the case study on that sale, we found ourselves quickly adding additional 7-figure businesses to the maretplace. (See here and here) When these sell, they’ll likely skew our average deal size as well. The great thing about these seven-figure deals is that they also bring in more mid-to-high six-figure businesses listing to our marketplace. Ultimately, they’ll help in driving up our average deal size over time, hopefully to where seven-figure deals will skew our data less and less as they become more common.
Perhaps the most interesting thing to see about our revenue is that, while in Q2 we did $6,693,934.96 and in Q3 we did $4,949,662.56, our actual gross earnings from both quarters are pretty close to each other, despite doing a smaller number of deals.
In Q2, our gross earnings were $669,903.19, and in Q3, they were $636,743.12, which is only a $33,160.07 difference. That difference is minimal and is equivalent to selling just one more $221k business in Q3.
The gross earnings numbers are close for a reason.
As our deals get larger, we end up doing a lot more deal structuring that involves earn-outs. We manage these earn-outs on behalf of the seller, so as the seller is paid their earn-outs over several months, we get the rest of our commission on the same timeline. The commission comes in every month, creating legacy revenue from previous quarters that gets activated in the current quarter.
If you have no idea what an earn-out is, check out our broker glossary of terms we wrote or learn more about deal structuring here.

Website Listing Fees
This has never been a major source of earnings for us, but as our listing values continue to grow it becomes an even smaller percentage of our earnings. Still, these listing fees can add up over the quarter, enough to match selling a smaller deal on our brokerage.
They also help us cover the costs of vetting businesses, the time and effort that goes into verifying that everything is legitimate, and writing the listing descriptions once the businesses are approved to go live on our marketplace.
We have two tiers of listing fees:
- First-time sellers pay a $297 listing fee to go live on our marketplace
- Returning sellers pay $97
In Q3, we earned $8,898 in listing fees. Effectively, that is similar to selling another $59,320 website. Here is the breakdown between first time sellers and repeat sellers for the quarter:
- First-time sellers: 28
- Repeat sellers: 6
These numbers buck the trend a bit. Typically, our quarters switch between having more repeat sellers and more first-time sellers. However, over the last two quarters, we’ve had more first-time sellers.
The reason for this trend could be our increasing exposure: we’re getting in all the ecommerce spaces, becoming a household name in ecommerce, and becoming the leading Amazon FBA broker in the industry. It could also be all the new connections and trust we are earning as we’ve spent a significant portion of 2017 attending different conferences around Southeast Asia, the U.S., and Mexico related to online businesses.
Investor Program
Nothing to report here. We’ve handed the entire portfolio over to the manager, and we have no earnings to report for the program. This will likely be the last quarterly report where we actually report anything on the investor program, as it’s been eliminated completely from the brokerage.
While it was a great idea, one that we still believe is an amazing opportunity, we’ve realized we might not be the right guys to run such a fund. At least not in the foreseeable future.
We are still hoping to eventually match talented operators with investors as they go about acquiring online businesses from our marketplace. This type of activity is something we’re very interested in doing down the road as we build out our Deal Center (more on that later).
Additional Revenue
Nothing huge to report here—mostly some legacy affiliate revenue. This category is also likely going the way of the investor program. The money earned through affiliate income is nothing compared to our brokerage.
Almost all of our content collaborations or promotions with others have zero affiliate links involved. We just like promoting good stuff to our audience; we don’t really care about the affiliate aspect.
Traffic and Audience
Below is the breakdown of our website traffic, podcast downloads, and email lists.
Blog Traffic and Analytics
Our traffic is down from Q2, going from 259,170 to 203,751 site visits. We expected this drop, though. Last quarter, we held a Reddit Ask Me Anything (AMA) that skyrocketed to the homepage of Reddit and drove a TON of traffic to our website.
However, we knew the Reddit spike would be short-lived once interest in the AMA died down. Even so, it’s still one of our Top 5 referrers, despite that AMA being done early on in Q2!
Here’s a snapshot of our traffic:
Here are the Top 3 Most Visited Pages on Empire Flippers:
Here are our Top 3 Most Viewed Listings:
Here are our Top 3 Most Viewed Pieces of Content:
- The 11 Most Popular Online Business Models
- Debate: Drop Shipping vs. Amazon FBA
- A Little Known Method to Removing Negative Reviews from Amazon FBA Product Listings
Here are our Top 3 Most Viewed Recent Pieces of Content:
- How to Start an Amazon FBA Business
- [CASE STUDY] How We Sold a $1.7 Million Amazon FBA Business in 8 Months
- Set Up and Start Selling: How to Create Your First Amazon Seller Central Account
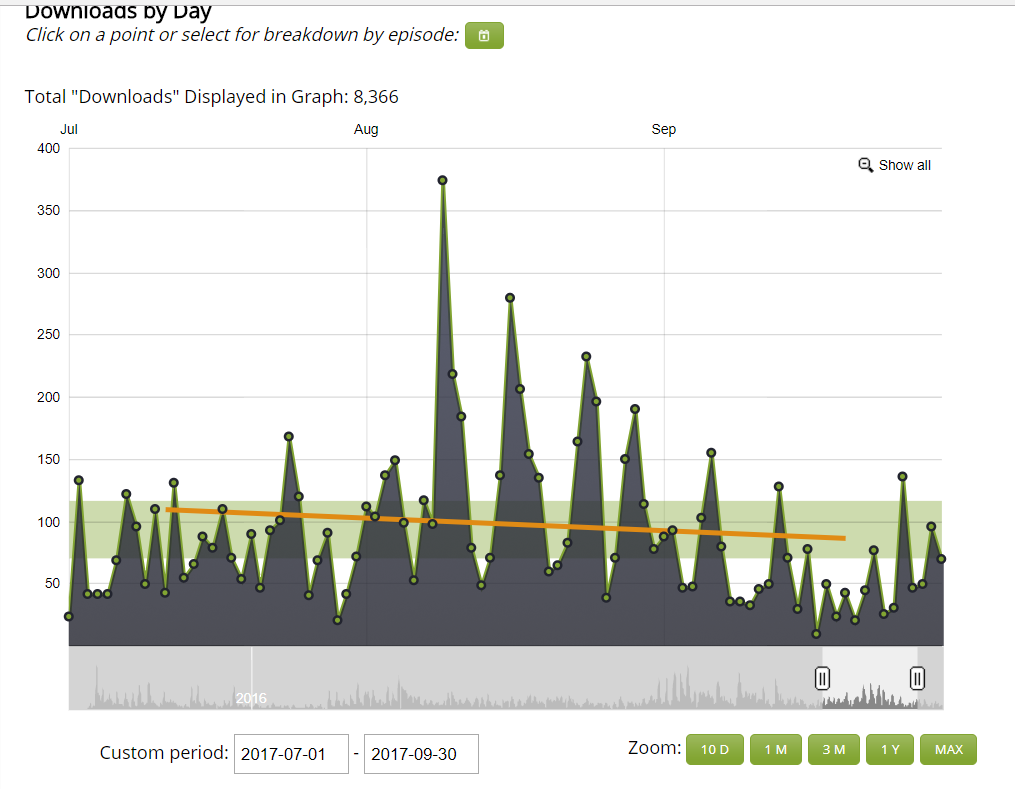
Podcast Downloads
We have a new addition to the podcast charts! In August, we launched the Digital Journey Podcast as a standalone podcast show. We also discovered a way to use this new podcast to expand our Youtube channel to a wider audience.
We had a total of 43,902 downloads across our three shows. While this number is more than last quarter downloads (where we literally didn’t publish a single new podcast), it’s still down from two quarters ago by 2,100 downloads. Fortunately, the new Digital Journey podcast has been getting great reviews and quite a lot of downloads for a new show.
As the show keeps producing regular content, along with a new Web Equity season and more Empire Flipper podcast episodes, we expect to eclipse our old numbers.
Here is look at the breakdown of each show:
The Empire Flippers Podcast Downloads:
The Web Equity Show Podcast Downloads:
The Digital Journey Podcast Downloads:

Email and Contacts
As we grow, email remains one of our most important assets. We have built out entirely new funnels for the seller side of our business, and going into Q4, we’re looking to replace the entire buyer funnel side of things as well. Our subscriber base is now at 42,835, with subscribers segmented into several different funnels.
For the new seller funnels, we have separated out the email lists into three main funnels: seller prospect, seller submitter, and seller customer.
Each of these funnels represent a different point of the customer journey. We feel we can give the sellers more value through these specific funnels, and increase our conversions overall, by focusing more on where the email subscriber is in the customer journey.
One thing we are looking forward to testing is converting seller customers into buyers. It is no secret that one of the best times to buy an online business is right after you sell one, as that is when you have the most money on hand to negotiate better deals.
Here is a chart of our subscriber growth; as you can see, it is a steady, incremental trend upwards:

We are still improving our email lists every week to give better content and value to our subscribers based on what they are actually interested in reading or watching. If you haven’t yet subscribed to our email list, click the link below that makes the most sense to you:
Which One Are You Interested In?
Click Here to share your buying interests
Click Here to share your selling interests
Customer Experience
The theme of Q2 and Q3 was a major focus on customer experience and our operations. We split our operations by three main divisions:
- Vetting
- Customer Service
- Migrations
This organization has helped us smooth out A LOT of customer service issues where people felt like we weren’t communicating with them. We’re not perfect yet, but it has vastly improved from where it was.
We will be looking to expand our vetting team shortly (look out for the hiring post) to help make our operations team even better.
We use Zendesk as our main backend for customer service, so let’s break down what happened last quarter:
Zendesk Support
Here are our numbers for Q3 2017:

Last quarter we had a huge improvement on our average first reply time. This quarter we saw our average first-time reply improve even more, dropping to 4.29 hours, almost a half hour better than Q2’s 4.59 hours. As our customer service team becomes more seasoned in the new process, we keep getting better at it. Hopefully, this trend continues to improve even more in the coming quarters.
Customer Feedback
We had a total of 5,943 new tickets this quarter, up from last quarter by 1,377. With this uptick in new tickets, we unfortunately also saw a pretty big increase in bad ratings. We went from just five bad ratings last quarter to 38 for this one!
On a positive note, we dramatically increased the amount of good ratings, too.
Last quarter we only had 128 good ratings. This quarter we had 360, almost tripling our good ratings.
Obviously, this is an area we are still looking to improve. The majority of bad ratings were people who believed we weren’t answering their questions sufficiently or people wanting updated profit and loss statements (P&Ls).
Unfortunately, we are at the mercy of sellers when it comes to obtaining updated P&Ls. If our sellers don’t provide them to us, we can’t provide them to anyone else.
If you’re looking to sell your ecommerce store, remember this one critical piece of advice: You need to be hyperresponsive with updating your P&Ls and responding to any questions if you want to have a quick and smooth exit of your business.
Here is the breakdown of our customer feedback:
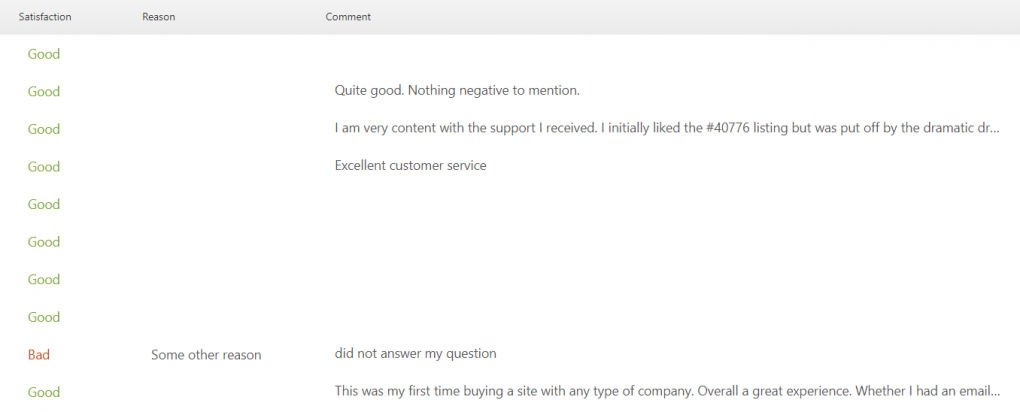
Q3 2017: 5,943 new tickets, 5,701 solved tickets, 360 good ratings, 38 bad ratings.

What Happened in Q3 2017?
A couple of things worth noting happened in Q3. Other than that, it was mainly business as usual. Of course, we were (and still are) grappling with our fast growth, which is why so much effort has been focused on improving our operational structure.
Let’s look at the main events of Q3!
The Digital Journey Show and the Deep Dive Podcast

This idea was born in Q2 but didn’t fully get executed until mid Q3. We wanted to make sure we had enough shows done to give us a few weeks lead time in case we didn’t get another guest on the show quickly enough.
The whole idea came from asking a simple question: How can we scale our content creation?
The obvious answer: Hiring more content creators!
The idea was to scale both our podcasting and our Youtube channel. Originally, the Deep Dive and the Digital Journey were going to be two different shows.
The Deep Dive would be a podcast that interviewed only people who buy online businesses, discussing their due diligence frameworks, how they find dealflow, negotiation strategies, and ultimately what they did to improve or maintain the business they bought. The Digital Journey, on the other hand, would be short-form video content where we would interview online entrepreneurs about their lifestyle and obstacles they’ve overcome.
Sadly, the first guy we hired for the Digital Journey didn’t quite work out for us. We didn’t follow our normal process for hiring contractors and employees, instead, hiring someone we knew and liked. This is a mistake a lot of entrepreneurs make, and we suggest you avoid it. Even if you do know someone well, have them apply the same as everyone else.
Then we faced a second hiccup in that the podcasters we hired for the Deep Dive weren’t super experienced in broker terminology and were not neck deep in the trenches of buying and selling online businesses. That lack of background knowledge made it difficult for them to go in depth during interviews and ask the right kind of questions to make this podcast really stand out.
It turned out one of the two podcasters we hired had extensive experience with Youtube marketing and video editing. In the end, we rolled the two projects together and ditched the Deep Dive idea (for now) and made the Digital Journey do double-time as both a podcast and a Youtube show.
So far it has worked: Our Youtube subscriber base has grown, and we’ve had over 8,000 downloads on iTunes. Plus, the show has generated over 30 high quality leads for us since its inception. It’s worth noting that these 30 leads are purely people who have opted in for the Digital Journey podcast rather than Empire Flippers’ email funnels.
We are going to look into optimizing this segment further as we keep producing the show. If the show is successful, we will likely also be turning our seller interviews into a podcast as well.
Empire Retreat 3.0
Usually our attendees can be divided between agency owners, affiliate SEO, and Amazon FBA entrepreneurs. This time around, we had the most diverse crowd of entrepreneurs, with several of them being purely online business buyers rather than builders.
Overall, it was a great event. We even had a few guests from the second retreat returning for this one.
While we don’t really make any money off these events, they do create long-term connections that can lead to future deals. Plus, well, they’re a lot of fun!
Too Many Leads!
One thing we created in our Hubspot backend was lead buckets showing subscribers that meet different kinds of criteria. Our sales team can then call those subscribers. At the moment, we are facing a great problem: We have too many leads for our sales team to call.
Our Business Advisors are BUSY people! Between closing deal after deal, negotiating between buyers and sellers, and attending industry events, they just don’t have that much spare time to call through all these lead buckets we’ve created for them.
Because of that, we decided to hire three Business Analysts to act as junior salespeople to help call top of funnel leads. While we’ll be hiring for this position in Q4 (you can read the hiring post here), we won’t actually be bringing anyone on until Q1 of 2018.
That’s a wrap for Q3 2017!

How did your business go? Did you see any massive growth? Let us know in the comments below!
Photo credit: KucherAndrey

Discussion
Justin, love your reports man, thanks for the transparency and courage to post them, including highlights and lowlights. Very authentic and engaging. Can you answer a quick question? I’m in the brokerage business (brick and mortar businesses- not websites), and I always consider my top line revenue number to be what you’re considering your ‘earnings’ number- as in, my gross revenues = the fees we collect. However, I see you consider your gross revenue to include ‘the big number’ as in the value of the websites you sell. Does that show up like that on your income statement because you’re playing escrow on the WHOLE thing- whereas I use escrow companies and my books never see the ‘big number’? I’d like to know your thought process there.
Thanks, Clint!
Yep – because we’re actually taking in the cash for the sale, we’re claiming as gross revenue/sales. What we label as earnings is actually our gross profit. (Revenue – COGS, so to speak)
We have costs beyond that of course. (marketing, team/salary, software, etc.) Take all that out and we’re left with our net profit. (Which is manipulated. We pay tax on this, of course, and so we reinvest most of our net profit into growth outside of what we keep)
Really inspiring as always. 🙂
Great rundown, Justin, I feel like I’ll earn an MBA someday if I follow your EF reports long enough.
Sorry the Investors program just isn’t taking off. You know I have been a supporter and agitator for that for a long time now. As you say, I think the idea still has great potential, I really hope the gears will click into place someday soon.
“Deal Center”? Sounds interesting.
Best regards
Thanks, Dave!
Yeah, bummed about the investor program, but excited to see others testing it out. I’m hoping it WILL work for others – I think there’s definitely some promise there.
We’re quite a ways out from the “Deal Center”, but definitely on the roadmap!