Our Q4 2018 Quarterly & Annual Report – October, November, and December 2018
 Updated on March 29, 2020

Another year has wrapped up, and 2019 has already been incredibly busy for us here at Empire Flippers. We’re a little later than usual with the report, but needed the extra time to put everything together – thanks for bearing with us!
At the time of writing this report, we have sold at least one online business for every single business day in the calendar year thus far in 2019, which puts us in a great position to do even better in 2019!
But…I’m getting ahead of myself. This report will be highlighting what went down in Q4 2018 sharing all of the details and lessons learned.
One big reason that we publish this type of report is our commitment to transparency, which we’ve often found lacking in our industry. We’re banking on the idea that if we can show you, in detail, what things look like behind the scenes you’ll have a better understanding of how buying/selling online businesses works. In addition, we view this report as a way to inspire you: our audience, our customers, and our friends.
We want to help you dream about what is possible with YOUR business as much as to tell you what is going on with ours.
Let’s dive right into it and see what went down in Q4 2018!
Executive Summary: Q4 2018 Report
Below is our marketplace graph presenting our revenue, quarter by quarter. While we still haven’t topped Q2 2018’s revenue, we did manage to bring in $8,165,033.84 in overall revenue; beating out our Q3 2018 figure of $7,930,476.42.
Both Q3 and Q4 were a bit of a mixed-bag for us in terms of our revenue/profits. (Especially when you consider the incredible first two quarters from 2018) Yet, when you look at our overall revenue trend, you can see that we’ve been growing at quite a healthy pace. The chart below shows numbers far greater than those we would’ve expected just a few short years ago.

Here’s a look at how our all-time marketplace trend has developed since 2013:

While Q3/Q4 didn’t grow at the same pace Q1/Q2 did, our overall trend indicates that we are still growing significantly year over year.
When you operate in high-ticket item sales, as we do with the six- to seven-figure businesses we feature on our marketplace, it is natural for slower months to feel a bit…slow. That is why it pays to keep careful records that will show you the overall trends of how your business is performing, beyond the month-to-month slog.
All it takes is a couple of businesses selling—or not selling, for that matter—to create more of those lumpy sales quarters. But if you compare what our sales volume has been over the last couple of quarters to what it used to be, you can see this lumpiness is decreasing (as we predicted it would).
As our sales volume and pipeline continue to solidify, we predict that our lumpy quarters will continue to even out and (hopefully) fade away almost completely. They will likely decrease until we head into the territory of deals worth $5 million and more—then the process will begin all over again.
Now that we have been attracting more seven-figure deals to sell with us, we’ll continue to look in 2019 at attracting larger buyers. We’re currently in partnerships focused on making club deals and private equity (PE) firms raising money to acquire online assets that we believe will be fruitful.
Of course, we are still just about the best show in town when it comes to the smaller sub $300k deals, too. We still handle these—even though they are fairly automatic for our team—because, ultimately, we still want to provide opportunities for early-stage buyers and sellers just getting started in their digital careers.
Q4 2018 Business Data
Business Data
Total Team Members: 59
Founders: 2
Sales Team Members: 13
Marketing Team Members: 5
Operations Team Members: 28
Engineering Team Members: 6
Human Resources Team Members: 1
Contractors: 4
Email Subscribers: 71,965
Q4 Podcast Downloads: 33,384
Total 2018 Podcast Downloads: 104,372
Q4 Site Visits: 311,257
Total 2018 Site Visits: 2,054,800
Revenue
Brokered Site Sales: $8,163,321.52
Listing Fees: $1,582.00
Additional/Other Revenue: $130.32
Average Deal Size: $123,686.69
Total Revenue: $8,165,033.84
Earnings
Brokered Site Earnings: $1,130,502.22
Listing Fees: $1,582.00
Additional Revenue: $130.32
Total Gross Earnings: $1,132,214.54
Revenue Breakdown
We just went over a lot of data up there. Let’s break each part down and explain what it means, how it happened, and what might be coming down the road next.
Brokered Site Revenue
In Q4 2018, we brokered 66 deals for a total brokered deal revenue of $8,163,321.52—just three fewer deals than we sold in Q3 2018 (69 deals for $7,917,914.84). While the number of deals we sold decreased slightly, our revenue actually increased somewhat.
This also brought up our average deal size from $114,752.39 in Q3 to $123,686.69 in Q4, which means Q4 2018 boasts the second largest average deal size of all our quarters. (The quarter with the largest average deal size thus far remains Q2 2018, in which our average deal size was $128,765.84.)
You can see our average deal size trend, broken down quarter by quarter, below:

If you look at our average deal sizes in 2018, you’ll see that every single quarter presented an average deal size in the low six-figure range. This is a great upward trend for us, considering how we only saw two quarters reach an average deal size of over six figures in 2017.
We believe that as more and more seven-figure deals start looking to us as the leading provider and marketplace in the online business market, our average deal size will continue to increase.
You don’t have to look very far on our marketplace these days to discover highly profitable and attractive seven-figure deals for sale.
Here are the seven-figure businesses that are currently live in our marketplace at the time of writing:
- Listing #45021: An Amazon FBA business established in the sports niche in March 2015, this company boasts 363 SKUs of highly reviewed products and is worth $3,016,271.
- Listing #45430: An FBM/FBA business package created in August 2014 in multiple niches, this company features 96 SKUs on the FBM side and 113 SKUs on the FBA side. Several of its products are print-on-demand items. Currently, the business includes a team of six employees and is valued at $1,940,487.
- Listing #45739: This Amazon FBA business was created in August 2016 in the office supplies niche. The company is largely managed by five remote employees, allowing the current owner to spend three to five hours per week brainstorming new marketing initiatives and researching new products. It is valued at $1,720,214.
- Listing #44987: A content business created in January 2017 in the information niche, this company is monetized through 40,000 affiliate offers via coupons. Five full-time employees currently manage the majority of the business. Currently, it is worth $1,591,920.
- Listing #44647: This Amazon FBA business was created in January 2016 in the mobile accessories niche and features 170 highly reviewed SKUs as well as an email list of 6,000 subscribers. It is valued at $1,461,244.
- Listing #45178: A drop shipping business established in April 2016 in the mobile technology niche, this company features several different traffic channels and a team of 13 employees that manage the majority of the day-to-day maintenance on both the marketing and operations sides. It is currently valued at $1,316,820.
- Listing #44772: This ecommerce and drop shipping hybrid business was founded in June 2014 in the furniture niche. The majority of store traffic comes from Craigslist, leaving many traditional traffic channels wide open for the new buyer to explore. This business is valued at $1,254,184.
- Listing #44934: A two-site info product package created in October 2015 in the photography niche, the main sites of this business boast an email list of over 300,000 subscribers and a social media following of almost 100,000 people. It is valued at $1,131,699.
- Listing #45386: This app, created in January 2017 in the social and networking niche, allows friends to easily coordinate with each other. It has over 3,000 reviews featuring an average of 4.4 out of 5 stars. A development team currently maintains the app and rolls out updates three or four times per month. All traffic to the app has come organically, as no paid marketing has been arranged thus far. Currently, this business is valued at $1,073,107.
As you can see, our number of seven-figure listings has grown significantly since the last quarter. There are over nine of these large listings on our marketplace right now—more than there have been during any previous quarter since we started tracking this metric.
While nine such listings are certainly a lot, we predict that more seven-figure businesses will appear on our marketplace as we continue to see more of these sellers trusting us to work with their businesses and get the job done.

Business Listing Fees
In Q4 2018, our listing fees came to $1,582.00, a figure far lower than Q3’s $12,474.00. Our listing fee is now so low that you’d have to go back a couple years to find a quarter that boasted a lower listing fee.
Listing fees have never represented a large proportion of our income, and to be honest, we’ve always used them as more of a filter to ensure that sellers are serious about working with us.
Since our sales department has expanded and now includes a new seller-focused team, this has become less and less of a problem. Potential sellers are talking with our business analysts on a weekly basis, and our analysts are able to determine when buyers are serious about selling their businesses.
This is important, as growth requires us to constantly increase our seller funnels and add more listings. “Feed the beast” so to speak. Having dedicated sales representatives focused on sourcing new high-quality listings is a priority for us through 2019.
Traffic and Audience
Blog Traffic and Analytics
Our blog has always served as one of our main traffic generators. Empire Flippers originally started off as just a blog where we discussed our own journey of building up niche sites monetized through Adsense.
Since its inception, our blog has grown significantly to cover all manners of online monetization methods along with breaking news, best practices for optimizing specific monetization methods or traffic channels, some of the most helpful tips you can find online in terms of buying businesses, and case studies of those who have sold their businesses.
You can look over our Q4 traffic metrics below:

We had over 300,000 sessions in Q4, and this figure is right on track with our slow but steady website traffic growth.
Here is the breakdown of our overall traffic from 2018:

Our website saw over 1,000,000 sessions in 2018, making 2018 our most highly trafficked year ever.
For comparison, here are our overall traffic metrics from 2017:

In 2017, our website had 890,528 total sessions (compared to its 1,164,272 total sessions in 2018). Our number of users increased from 540,115 in 2017 to 708,141 in 2018. While most of the other metrics remained relatively similar between the two years, our overall number of page views shot up from 2,493,309 in 2017 to 3,275,579 in 2018.
Here are our Q4 traffic metrics, broken down by channel:

Here is a breakdown of the overall metrics of our traffic channels from all of 2018:
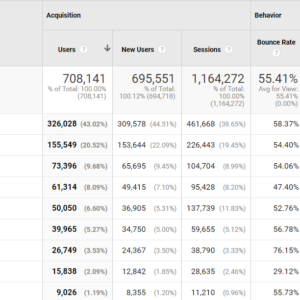
The first thing that jumps out at us about these numbers is that organic searches make up the lion’s share of our traffic. In 2018, we experimented with various marketing channels, but nothing served us as well as good, old-fashioned, high-quality content that ranks well in Google searches.
In 2019, we will double down on our content creation to produce even more content for our audience that both ranks highly in Google searches and will be greatly valuable to our readers.
It is always interesting to see what people are actually looking at on our website. Let’s break down the pages on our site that saw the most views in their respective content categories.
Below are the top viewed pages, listings and content for Q4 2018:
Here are our Top Three Most Viewed Pages:
Here are our Top Three Most Viewed Listings:
- Listing #45021: An Amazon FBA business in the sports niche featuring 363 highly reviewed SKUs. It is listed at $3,016,271.
- Listing #44987: A custom-built site that monetizes coupons across 40,000 different affiliate programs. It is listed at $1,591,920.
- Listing #44934: A two-site content package in the info niche, specifically dealing with photography, listed at $1,131,699.
Here are our Top Three Most Viewed Pieces of Content:
- Top 10 Affiliate Networks and Programs That Aren’t Amazon in 2018
- 11 Most Popular Online Businesses
- Buying & Selling Amazon FBA Businesses: What Our $3,650,106.28 Case Study Found Out in 2017
Now, let’s look at what the most popular pieces of content were throughout 2018 as a whole.
Here are our Top Three Most Viewed Pages:
Here are our Top Three Most Viewed Listings:
- Listing #44246 (SOLD): A drop shipping business in the transportation niche listed at $24,874.
- Listing #45021: An Amazon FBA business in the sports niche featuring 363 highly reviewed SKUs. It is listed at $3,016,271.
- Listing #40979: An info product and two-site service package in the financial and stock trading niche valued at $934,185.
Here are our Top Three Most Viewed Pieces of Content:
- 11 Most Popular Online Business Models
- Top 10 Affiliate Networks and Programs That Aren’t Amazon in 2018
- Set Up and Start Selling: How to Create Your First Amazon Seller Account
Podcasts and Shows
Podcasts remain one of our favorite marketing channels. Our various shows are downloaded thousands of times every month, and they allow our audience to dive deeper into our world in and connect with us in a fun, engaging way.
These internet shows are something we would eventually like to do more often to explore other topics exclusively within the buying and selling sphere.
Here is a breakdown of how our shows did in Q4 2018 and over the year as a whole.
Empire Flippers
The Empire Flippers Podcast is our flagship show. It was our first show and remains our most popular one, boasting 19,476 downloads in Q4 and 72,754 over the entire year. It is responsible for the bulk of our downloads and is, by far, a fan favorite.
Here are the Q4 2018 Libsyn analytics for this show:

This chart depicts data from the entire year:

The show is a general business podcast in which Justin Cooke and Joe Magnotti talk in-depth about particular business topics or Justin interviews guests who have accomplished fascinating feats in the online business world.
The Web Equity Show
Our Web Equity Show is a joint venture between Empire Flippers and Ace Chapman. Instead of being a weekly podcast featuring new guests, it is released in “seasons.” In each season, Justin and Ace will examine a specific aspect of buying or selling online businesses.
It has become such a great podcast that we want to give it wider reach by featuring it on our website as well as on our new updated podcast page.
Now, you can simply click “Web Equity Show” on this page, view all its episodes, and listen away to your heart’s content.
Here are the Q4 2018 Libsyn analytics for the Web Equity Show:

Here are those same numbers for the year overall:

In Q4 2018, the show saw 9,723 downloads. It was downloaded 21,460 times throughout 2019.
Now that the Web Equity Show is featured on our new podcast page, we hope our audience will be able to find it more easily.
Real Money Real Business (RMRB)
Real Money Real Business is a spinoff podcast based around the very best interviews that we have had with business owners looking to sell their companies through our platform.
To be invited for an interview, sellers must meet the minimum requirement of selling a business worth at least $45,000 when it goes live on our marketplace. The very best of these interviews are then uploaded to the Real Money Real Business podcast.
The idea here is that, unlike most podcast platforms that interview entrepreneurs, we actually know what these entrepreneurs are making. We’ve combed through their P&L statements, we’ve seen their traffic, and we know they’re legitimate entrepreneurs with legitimate knowledge to share.
Here are the Q4 2018 analytics for Real Money Real Business:

Here are the numbers for 2019:

As you can see, we started this podcast near the end of the year. Further, it is to be expected that it would take third place in terms of popularity since it features repurposed seller interviews rather than brand new content.
Nonetheless, Real Money Real Business still gets a fair number of downloads and a decent viewership, and in the last couple of months, it has directed more people than ever—including people interested in buying the businesses featured on the show or similar businesses—to our seller interview series.
Email and Contacts
Email remains a core business channel for us.
Through various email marketing automation, we encourage people just looking in at the online business world to actively invest in or sell a business of their own through our marketplace.
Email also remains our primary method of promoting our marketplace listings.
We have always attempted to tailor our emails to individual clients, and this is something we are getting better at. This will be especially true later in 2019 when we will be working on entirely new email-based marketing funnels that will appear to our audience members according to how they created their accounts.
In Q3 2018, our email list was sitting at 66,706 subscribers. That number has since increased to 71,965.
While this does not represent a staggering increase in email subscribership, it matches the slow and steady upward trends of our other marketing metrics.
You can see the growth in our email list size over time below:

And this graph shows the growth of our email list size from Q3 2018 to Q4 2018:

This metric’s growth curve is perhaps best understood when we look at 2018 as a whole:

Email has always been a core focus of ours, and this will remain true in 2019. We will continue to look for ways to both increase our ability to effectively nurture subscribers into clients and to present amazing, high-quality content that our subscribers truly want to digest.
If you want to watch our progress and be the first to see some of this new content coming down the pipeline, please see the options below and click on the one that interests you the most.
Which One Are You Interested In?
Click Here to share your buying interests.
Click Here to share your selling interests.
Customer Experience
Zendesk Support
Zendesk remains our workhorse when it comes to customer service software. Almost all client communication is handled within the Zendesk ecosystem (for better or for worse). At times, it works amazingly well, and at other times, complications arise due to Zendesk’s many quirks.
For instance, subject lines can be tough to change, and they often don’t help buyers understand which ticket has the most up-to-date information or which deal an email is even telling them about.
Luckily, this is something we are adjusting. By the end of 2019, it will no longer be an issue thanks to several new projects we’ve been working on behind the scenes.
Here are our Zendesk metrics from Q4 2018:

In Q3 2018, our average first reply time was 3.17 hours, which is faster than Q4 2018’s average of 4.24 hours. While our average reply time has become slightly shorter than Q2 2018’s average of 4.46 hours, our satisfaction rating has remained the same as that of Q3 2018: 88%.
Customer Feedback
In Q4 2018, we saw 8,779 new tickets and 8,257 solved tickets with an 88% overall customer satisfaction rating resulting from 408 good ratings and 55 bad ratings.

Those figures in Q3 were 9,751 new tickets, 9,559 resolved tickets, 411 good ratings, and 57 bad ratings. These numbers also resulted in an 88% overall customer satisfaction rating.
Let’s look at some of the actual feedback our customers have given us:


As you can see, two of our bad ratings were products of email communication problems. Partly to blame are the old email-based marketing automations we set up in the past, but another issue is the way Zendesk sends out notifications whenever a ticket is updated.
This can be a pretty frustrating experience for some customers, and, as we mentioned earlier, it’s something we’re working on fixing in 2019.
In terms of positive reviews, many of our customers loved our professionalism and our promptness in finding answers to any questions and challenges they faced with their specific deals. This remains consistent, month after month and year after year, as our customers interact with our teams.
What Happened in Q4 2018?
A lot went down in Q4 2018!
We joke internally that the final quarter of the year is “Conference Season.” You’ll see from the list below that seemed to be the case again this year, considering the fact that we went to seven conferences in Q4 2018!
Dynamite Circle Bangkok (DCBKK)

DCBKK is always a blast. Our company grew up with the Dynamite Circle, and it is always fun to reconnect with old pals, make new friends, and talk shop in beautiful Bangkok. Dynamite Circle is a lifestyle organization dedicated to location-independent entrepreneurs and serves as a place for digital nomads to connect with one another on their travels.
If you’re a digital nomad or a location-independent entrepreneur looking to connect with like-minded professionals, we definitely recommend that you join the Dynamite Circle.
Affiliate World Asia
This was our third Affiliate World event and the second one we attended in Asia, and it was delightful (as always). It is an interesting blend of a trade show, a conference, and provides fantastic networking opportunities. This year, we also got to attend Erick Dyck’s eCommerce Live after-conference, a smaller conference focused specifically on ecommerce topics.
Additionally, we had the chance to meet many friends, including Depesh Mandelia and Earnest Epps, in person for the very first time.
Chiang Mai SEO (CMSEO) Conference

We had a lot of fun at CMSEO again this year. CMSEO is a conference run by Matt Diggity of DiggityMarketing.com. It is perhaps one of the largest conferences in the SEO industry that focuses on the SEO entrepreneur rather than purely agency- or enterprise-level content.
At CMSEO, you’ll meet people who create fleets of niche and authority sites and run profitable agencies and countless service providers for every single level of the SEO ecosystem.
It is a special event for us and one we’re looking forward to attending again in 2019. Also, if you’ve never been out to Chiang Mai, Thailand, it is a great excuse to check out a city that is steeped in history and cultural lore.
Digital Marketer Skill Share (DMSS) Conference
The DMSS conference was a great time. We sponsored this event and were invited to speak onstage about content marketing. We had an interesting crowd that was composed more of digital marketing agencies than of entrepreneurs building their own online business. We enjoyed several intriguing talks on building ecommerce businesses that we found fascinating.
If you’ve never been to Bali, the DMSS event is a great way to convince yourself to go. The conference featured some of the industry’s best of the best—from SEO experts to social media gurus—speaking on stage and hanging out with other attendees.
Drop Ship Lifestyle (DSL) Retreat

We’ve been big fans of Anton Kraly’s Drop Ship Lifestyle business for many years. In fact, we’ve sold quite a few of his students’ drop shipping businesses on our marketplace. He teaches a very sustainable way of building brands that can become real assets that investors want.
Every year, Anton organizes the DSL Retreat, and we’re usually there to speak and educate his audience. This year was no different as we gave a presentation to his students and connected with them on a deeper level.
Rhodium Weekend
Rhodium Weekend, run by Chris Yates of Centurica, is the industry’s main event when it comes to buying and selling online businesses. We flew to Las Vegas and got to hang out with several old friends, threw a nice networking party, and meet many new friends along the way.
Focusing on Systems, Processes, and Optimization in 2019
As 2018 wrapped up, our team grew significantly to include more than 50 members. When a company grows as rapidly as ours did, a number of systems and processes that reflect an older version of the company are bound to continue to run until they can be updated.
This means that a major focus for us in 2019 is to review all such systems and processes. In some cases, we will be optimizing what we already have, and in other cases, we will be designing brand-new systems and processes.
Goals like these are always moving targets for quickly growing companies, but they are important objectives to keep in mind.
As we move into 2019, we will be looking for the most scalable solutions to our challenges that can both handle our huge sales volume and provide our customers with the best possible experience when using our marketplace.
That Wraps Up Q4 2018 (and the Year)!
And that’s a wrap!
Last year was a crazy ride in terms of growth from both hiring and revenue perspectives.
Since 2019 will be focused primarily on systems updates, our prediction is that 2019 won’t be as explosive as 2018 was in terms of revenue growth. However, our process optimization gains will set us up in a big way to grow aggressively again in 2020.
Hopefully, you’ve found a lot of value in this report and are inspired by what you and your business are capable of. There is nothing stopping you from taking your business to ever greater heights—at the end of the day, all it takes is hard work and effective planning.
So – how did your Q4 shake out? And 2018 overall? Let us know in the comments – we’d love to hear from you!
