Q4 Report – October, November, December
 Updated on March 16, 2020

It’s that time of the year!
Time for another update on how things went last quarter, and as the first report of 2020, we’ll check out how things went in 2019 overall. These reports are always written as a kind of report card to show where we’re at and to keep ourselves accountable. On one hand, it helps us remain true to our commitment to being transparent to you, but on the other hand, we also hope it just inspires you to greater heights in your business and digital investing.
We just wrapped up 2019 and it was a bit of a roller coaster.
Our biggest year ever, and by far the most profitable.
We focused throughout 2019 on building better systems, healing the growing pains from 2018, and dialing in our value proposition with our customers. Things went well financially and we were able to hit most of our goals.
The most exciting part about hitting our goals in 2019 is that, in 2020, we can look to expand even further.
Alright, let’s dive into some of the actual numbers and what went down in Q4 and the year overall.
Executive Summary: Q4 of 2019 Report
We’ll start with a look at our business data, revenue, and earnings, before breaking each of these down further.
Q4 of 2019 Business Data
Business Data
Total team members: 60
Founders: 2
Sales team members: 13
Marketing team members: 6
Operations team members: 29
Engineering team members: 7
Human resources team members: 1
Contractors: 2
Email subscribers: 85,544
Podcast downloads: 232,270
Site visits: 439,625
Revenue
Brokered site sales: $14,875,873.23
Listing fees: $6,334.00
Additional/other revenue: $71.12
Total revenue: $14,882,278.35
Average deal size: $252,133.44
Earnings
Brokered site earnings: $1,695,388.44
Listing fees: $6,334.00
Additional/other revenue: $71.12
Total gross earnings: $1,701,793.56
2019 Financial Numbers
Revenue
Brokered site sales: $51,466,892.01
Listing fees: $34,307.00
Additional/other revenue: $637.24
Average deal size: $190,433.88
Total revenue: $51,501,836.25
Earnings
Brokered site earnings: $6,091,134.28
Listing fees: $67,429.94
Additional/other revenue: $474.21
Total gross earnings: $6,125,915.49
Our marketplace, team, and place in the industry continued to grow as we headed deeper into 2019. On average, our marketplace has had anywhere between 80–100 different businesses for sale at any one point. While we’ve always done well when it comes to deal flow in the 5-6 figures, we’re also starting to lead in 7-figure deals available for sale at any given time.
Nine 7-Figure Businesses for Sale Right Now
We are continuously growing our marketplace. It was only a few years ago that the idea of listing multiple 7-figure listings was so far out of our reach. That is not the case at all anymore.
We regularly get 7-figure businesses on our marketplace now, and more are clamoring to get through our vetting process to access hungry buyers.
Earlier in 2019, we even had an 8-figure business on the marketplace. The days of when we were considered the place to go “for small sites only” is truly over. Nowadays, we regularly field calls with funds, private equity, and high net worth investors to help them deploy capital acquisitions, sometimes in the millions.
So what are the current 7-figure businesses listed?
As of this writing right now, here are all of the 7-figure deals we have for sale on the marketplace:
- Listing #44985: Created in August 2014, this Amazon FBA and wholesale e-commerce business focuses on the electronics niche. The business earns 85% of its revenue from Amazon across 55 SKUs. With that many SKUs, there are tons of opportunities for optimizations, both in price points and actual listing copy. The business is valued at $2,705,978.
- Listing #46889: An Amazon FBA business created in October 2017 in the health and fitness niche. The business employs a team of eight people, which means the business requires minimal work from the actual owner. They help people with certain medical issues across their 24 SKUs, which feature both trademarks and being part of Amazon’s Brand Registry 2.0 program. The business is valued at $2,701,176
- Listing #46444: An e-commerce and dropshipping business created in June 2014 that operates in the home niche. The business drives 97% of its traffic through paid search, with close to 2,000 subscribers receiving weekly emails about high-end outdoor furniture and accessories. A seasonal business by nature, yet it shows strong growth. The business is valued at $1,891,273.
- Listing #46538: A SaaS business created in January 2009 in the business niche. The software helps business owners find certain types of leads. The majority of customers are acquired through paid media, with a smaller portion coming from social media and word-of-mouth. The SaaS is valued at $1,479,170.
- Listing #44987: An affiliate business created in June 2017 in the information niche. The custom built site features coupons for more than 40,000 affiliate deals. The seller has created a systemized process to roll out new coupon offers, thus requiring minimal work by the actual owner. The business is valued at $1,571,922.
- Listing #46490: A dropshipping and e-commerce business created in October 2016 in the apparel and accessories niche. The majority of the traffic comes from paid search, but it also features a healthy amount of traffic coming from social media and direct sources. The business is valued at $1,148,741.
- Listing #46603: An affiliate and advertising business created in May 2012 in the health and fitness niche. The product offerings help people with specific diet plans. All the content is outsourced and the majority of the traffic comes from social media. The business is valued at $1,122,228.
- Listing #46948: An Amazon FBA business created in September 2017 in the home and kitchen niches. The business features 15 SKUs with the majority of customers in the USA and a small amount from the UK and Australia. The FBA store is also enrolled in Amazon’s Brand Registry 2.0. The business is valued at $$960,873.
- Listing #46062: An affiliate business created in January 2014, utilizing two different websites in the technology niche. The business has19 different affiliate offers and reported year-over-year growth with minimal work done by the owner. The business is valued at $959,593.
This is the most 7-figure businesses we’ve ever had on the marketplace at a given time. While having nine on the marketplace at once is amazing, we’re expecting to have far more before 2020 is over and done with.
If you’re wanting to look deeper at one of the businesses above and you are qualified to buy one, then schedule a call with our analysts here.
Revenue Breakdown
Looking at the hard business data above is interesting, but it doesn’t paint our full story. Let’s break down the business into the revenue we earned and the actual earnings we got to keep from that revenue.
Brokered Site Revenue
Q4 2019 boasted our largest revenue in company history, $14,875,873.23, beating out Q3’s $14,345,345.68. This is a slight increase from Q3, and when you look at Q3 and Q4 combined, you can see we made a huge jump in revenue from the year’s earlier quarters, especially when looking at the previous year’s earnings.
You can see our growth quarter by quarter below:
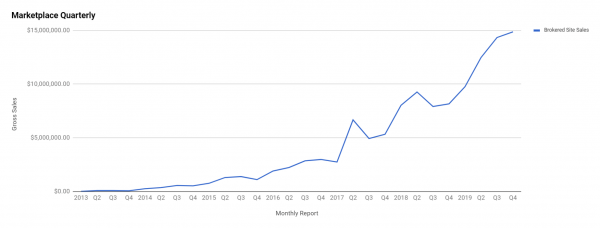
Here is a look at our revenue throughout time:

The second graph shows strong growth over the years. The first graph tells more of the story though. When we first started selling 7-figure businesses, you can see the big jumps in revenue coming in chunky spikes.
As the year progressed though, these spikes became a smoother upward trend. What this means in practical terms is that we are selling more 7-figure businesses consistently, along with smaller businesses. We sold one less business in 2019 versus 2018, and yet our growth has not been inhibited by that because the businesses being sold on our marketplace were just bigger.
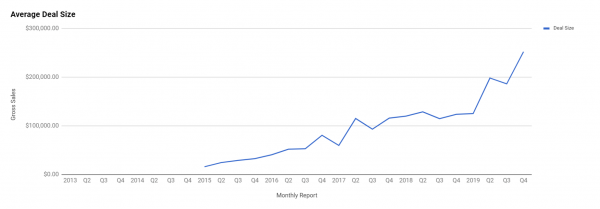
As you can see, our average deal size began to skyrocket over the last year. In Q4, our average deal size came out to a whopping $252,133.44, a huge increase from Q3’s $186,303.19 average deal size.
In 2019 overall, our average deal size was $190,433.88.
This is by far our largest yearly average deal size on our marketplace. If trends continue though, then it certainly won’t remain our largest for very long. Already, we’re seeing bigger deals come onto our marketplace during Q1 2020 that will help us make 2020 a new record year of growth for us.
We expect that 2020 will be the new record holder in terms of revenue and average deal size, likely before the year is done, around the Q3 mark.
Business Listing Fees
Our business listing fees have always been a way to force sellers to qualify themselves for our time. We charge a first time listing fee of $297 and a returning listing fee of $97. This has never been a big money maker for us, as it really is just a filtering process to see who is serious and who isn’t when it comes to selling their business.
The majority of listings on our marketplace never pay a fee since we’ve scaled up our sales team. Nowadays, a majority of sellers will talk to our Exit Planning team before listing on our marketplace to help them get better valuations and higher sales prices.
Still, the listing fees are doing their job for those sellers that decide they just want to list without talking to anyone. In Q4, we recorded $6,334.00 in listing fees. Part of these fees goes into supporting the resources required to vet a business before it goes live on the marketplace.
Even so, if a business pays the listing fee and gets rejected, we refund the listing fee to that seller so they lose nothing in the process. Considering we reject around 88% of businesses that submit to sell with us, the majority of listing fees get refunded. The $6,334.00 are from businesses that did get approved on the marketplace.
If you’re looking to sell your business, you start the listing process here.
If you’re running a business that is earning at least $3,000 average net profit per month, you can click here to schedule an exit planning call with us.

Traffic and Audience
Blog Traffic and Analytics
Our blog remains one of our biggest traffic sources. We regularly publish high value content surrounding various online business topics. Recently, we covered such things like how to sell your business to private equity, whether you should build an FBA brand or just launch random products, and a great case study of how we sold a six-figure SaaS business in less than 48 hours.
In Q4, we saw 439,625 sessions hit our website.

That is a huge number, but unfortunately some of those sessions are inflated due to an error we had when we were running traffic tests for our newly launched marketplace. We sent a bunch of Linux bots to test the platform at that time, making sure it wouldn’t break and optimizing the overall user experience.
The tests were still being run, which led to us getting 57,977 sessions logged from a Linux operating system. Some of those were probably real users, but we realize we’re probably not that popular within the Linux fan base and can safely assume almost all of it was bot traffic from our engineering team.
Removing those sessions leaves us with 381,648 sessions for Q4, a staggering increase from Q3 where we had 310,014 sessions.
That is a nice 23% bump in overall engaged traffic to the website, and that we’re very happy with!
Here is how our referral sources went down in Q4:

And here is our overall traffic for the entirety of 2019:
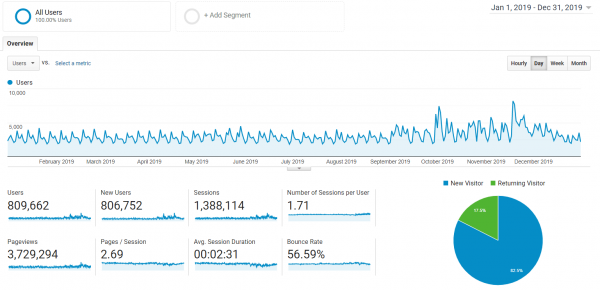
We had 1,388,144 sessions on our website, 1,304,944 sessions after removing the accidental Linux traffic. Quite the increase over 2018’s overall traffic:

That’s a solid 12% year-over-year growth in terms of sessions and a 14% increase in actual unique users in 2019 compared to 2018. Our brand keeps creeping up over the years, becoming more and more mainstream,, talking about digital assets as a comparable asset class to real estate or stocks.
But what did most people want to see? Let’s look at some of our top pages in Q4 and 2019 overall.
Q4 Statistics
Here are our top three most viewed pages:
What is most exciting is the fourth most visited page on our website…our new login page.
The login page allows you to register for our new marketplace. If you haven’t registered yet and you’re looking to invest in digital assets, we highly recommend it. The new marketplace will speed up your due diligence by a large factor. You can click here to register now.
Here are our top three most viewed listings:
- Listing #46631: (SOLD!) An affiliate business in the gifts and occasions niche. Valued at $46,448.
- Listing #44985: Remember this listing? We mentioned it earlier in the 7-figure businesses for sale, but as a reminder this business was created in August 2014, this Amazon FBA and wholesale e-commerce business focuses on the electronics niche. The business earns 85% of its revenue from Amazon across 55 SKUs. With that many SKUs, there is tons of opportunity for optimizations to be done, both in price points and actual listing copy. The business is valued at $2,705,978.
- Listing #46935: (SOLD!) An Amazon FBA and dropshipping business created in August 2016 in the home and office niche. Valued at $40,560.
Here are our top three most viewed pieces of content:
- How to Start an FBA Business
- The 11 Most Popular Online Business Models
- The SaaS Business Model Explained
And here are our top three most viewed pieces of recent content:
- [Case Study] Flipping an Affiliate Website for $136K in 16 Months
- How It Works (Our new on-boarding section filled with articles!)
- How to Flip an E-Commerce Business for $345,000
2019 Statistics
Now, let’s look at the same categories for the entire year.
Here are our top three most viewed pages in 2019:
Here are our top three most viewed listings in 2019:
- Listing #44987: We mentioned this one in the 7-figure businesses for sale as well. An affiliate business created in June 2017 in the information niche. The custom built site features coupons for more than 40,000 affiliate deals. Valued at $1,571,922.
- Listing #45021: (SOLD!) An Amazon FBA and ecommerce business created in March 2015 in the sports niche. Valued at $2,795,618.
- Listing #45578: (SOLD!) A 4-site Adsense business package created in September 2017 in the technology niche. Valued at $38,608.
Here are our top three most viewed pieces of content in 2019:
- The 11 Most Popular Online Business Models
- The Lead Gen Business Model Explained
- How to Start an Amazon FBA Business
And here are our top three most viewed pieces of recent content in 2019:
- [Case Study] Flipping an Affiliate Website for $136K in 16 Months
- 2019 Trends for Buying and Selling Online Businesses
- The Online Business Models Investors Love
Podcasts and Shows
Podcasts remain one of our favorite ways to communicate. In 2019, we started producing more Empire Flipper episodes, even while we produced very few Real Money Real Business podcast episodes. Part of the reason for this is simply because our buddy, Jake Davis, left the team (we miss you, buddy) and so we’ve been racking our brains how to do a relaunch that adds something extra to the show.
Podcasts are one of the best mediums out there for us to explore topics in depth with an intimate long-form medium. Since our service has a lot of nuances associated with it, podcasting is one of the best content mediums outside of actual blog posts for us.
If you want to listen to our shows, you can find all of them here.
Let’s take a look at some of our Q4 and overall 2019 statistics related to our audio channels.
Empire Flippers Show
The Empire Flippers Show remains our flagship show, featuring founders Justin Cooke and Joe Magnotti as co-hosts. Sometimes, it is just them going back and forth over an interesting business insight or specific challenge with running a remote team. At other times, it features Justin interviewing highly influential entrepreneurs and thought leaders about their journey.
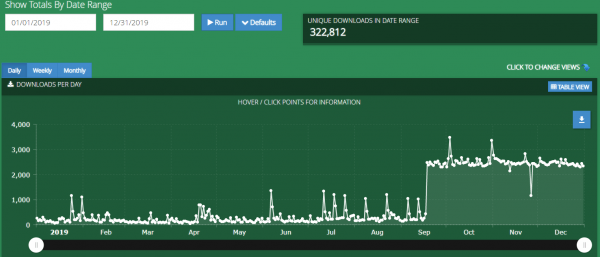
We had a huge amount of downloads in Q4 with 226,697 listeners checking out our episodes. You can the graph here:

We recently launched all of the podcasts on Spotify as well, which has added a nice little boost of 923 downloads in Q4. Mind you, the majority of our listeners are finding and listening to our podcast on our actual website.
Q4 made up the lion’s share of our listens for the entire year, with 2019 ending up at 322,812 unique downloads. Check out the graph here:
Our most listened to episodes in 2019 were:
- EFP 192: Mark Manson On Which Fucks To Give
- EFP 191: Online Business That Don’t Sell In 2019
- EFP 190: Founding Mercury Bank w/ Immad Akhund
The Web Equity Show
The Web Equity Show is a jointly hosted show with our co-founder Justin Cooke and the business buying mogul Ace Chapman. Unlike a traditional podcast, we do Web Equity in seasons. This gives each release an almost “Netflix”-like binge worthiness.
Out of all the content we’ve produced, the Web Equity Show is by far the most structured for someone wanting to really dive deep into buying and selling online businesses. Each season focuses on a specific theme with the episodes exploring all the nuances in depth.
Here are how many downloads we had in Q4:
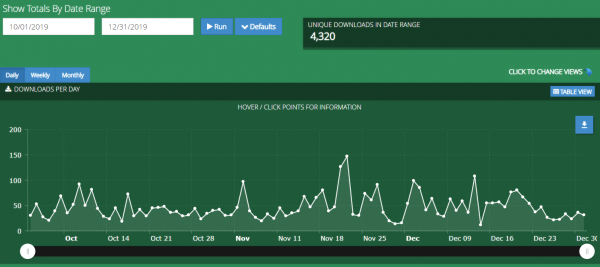
We had just 4,320 unique downloads in Q4, which is slightly higher than Q3’s 4,119.
Here are our downloads for the entire 2019 year:
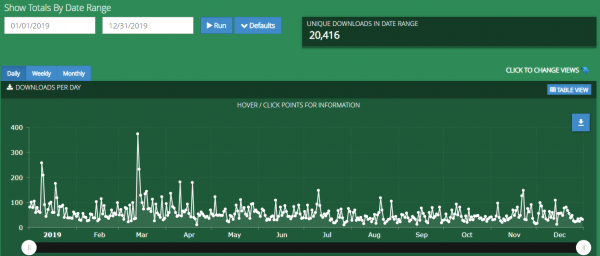
We had 20,416 downloads altogether for the year. That is actually slightly less than last year’s total at 21,460 downloads. Even so, it is not a huge decrease and considering how old the content is now with no updates, we’re pleased with the recurring listenership at the moment.
That doesn’t mean we aren’t planning to do more episodes in the future, of course. The Web Equity Show is still alive and well. Justin and Ace have just taken a break from it for now.
Here are the most listened to episodes in 2019:

Real Money Real Business
Real Money Real Business (RMRB) was really designed to get the word out about our seller interviews. We’ve taken a break, as mentioned earlier, while we consider the future of the show. We think it’s a great value add though, since most people that listen to our seller interviews on YouTube tend to consume them like a podcast anyhow. So why not grow that distribution?
Here are the number of unique RMRB downloads for Q4:

RMRB got just 1,253 downloads, which isn’t bad considering how little love we gave it this year. We may turn this around by either trying to find a way to offer more value that works within our production system, or we may just start posting 100% of our seller interviews. After all, the main purpose of the show was to give our audience access to another way to hear about what is for sale on our marketplace.
It definitely has potential, considering we didn’t really post anything in Q3 and still got 3,029 downloads.
Here is the chart for the entire year:
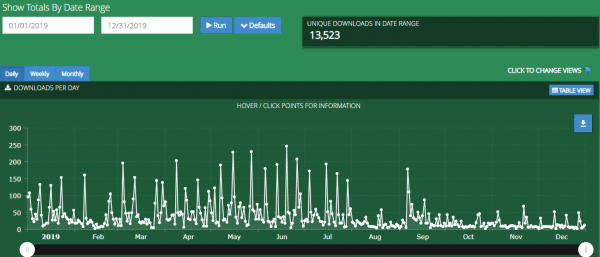
As you can see, despite this being largely a content repurposing play, we got 13,523 downloads in 2019.
It’s nowhere near the Empire Flippers Show, but more than the Web Equity Show for the amount of work on our part. There will be more on content repurposing later in this report, as it is something I’ve made into a kind of hobby horse of study for myself.
Here are the top RMRB episodes for the year:
- RMRB 50: Building an Authority Site with Multiple Revenue Streams
- RMRB 49: Having Strong Social and Email Followings
- RMRB 48: Making a Living With Amazon FBA
Email and Contacts
Email remains one of our most valued marketing channels, if not one of our most complicated ones.
Here is a snapshot of our email subscriber growth for 2019

We have a total of 85,544 active subscribers, which is up from last quarter’s 81,756. It is not spectacular growth by any measure, but we actually collect an average of 500-600 new contacts per week.
Our email experience needed a big improvement. A big focus in 2019 was to re-do 100% of our email marketing funnels. We made it to 95% in terms of entirely new email funnels. These new funnels provide more relevant content based off where our audience is in their buyer’s journey. For example, someone selling an e-commerce store when they use our valuation tool, will get follow-up content related to just e-commerce.
The real story of our growth is told when you zoom out. Hubspot allows us to display the last three years of growth all at once, showing the steady but powerful rise of our brand over the last 36 months.

Thanks to a few new developments (getting our email marketing funnels refreshed and launching our on-boarding articles section to help new customers), we’ll be focusing a lot more on growing this channel.
2020 should be our biggest year yet in total net subscriber growth, featuring more content that is relevant to our audience with where they are at any specific moment.
If you want to experience the new funnels, then either download our popular online business models book if you’re a buyer, or fill out our valuation tool to get specific monetization advice.
Email subscribers, of course, is just one metric that shows the size of our database. Currently, all contacts across our database are sitting right at 131,119 contacts. This means we have one of, if not the, largest, databases in the entire industry when it comes to our ability to match buyers with sellers.
Customer Experience
It’s no secret that our business is stressful.
Even if everything goes perfectly, like the majority of deals struck on our marketplace, it is still stressful. It is very rare that those buying or selling do so on such a consistent basis that the event isn’t a high-mark event in their lives. For some people, , the amount received for selling their business is absolutely life-changing. For some buyers, the amount they’re paying is one of the largest investments they’ve ever made in their lives.
As you can imagine, buying and selling can be challenging emotional experiences as well as amazing wealth-building opportunities when our customers come to us.
That is why customer experience is so important to us.
We’re still using Zendesk as the main workhorse for customer communication for us. Let’s take a look at our customer feedback.
Customer Feedback
As you can see, the majority of the feedback has been positive for us. Our focus is ongoing and crucial to make the customer experience as seamless as possible. Since so many of our customers are repeat buyers and sellers, we want to make sure the experience they have with us is so fantastic that they’ll tell their peers about us. However, we also truly want them to succeed, whether they end up selling their business with us or buying one off our marketplace.
What Happened in Q4 of 2019?
Now that we have all the data out of the way, are there any highlights for Q4?
Well, yes, quite a few! Let’s dive into them.
Reimagined “How It Works” Page
We redesigned our How It Works page to act as our blog’s category page. As the businesses we sell on our marketplace became bigger, it became important to educate visitors on all the nuances that enable an M&A firm like us to help you.
The blog category page will give you the 30,000-foot view of how all of our processes work in tandem to help you exit your business or buy a business. However, if you want to go deeper and really understand our processes, just scroll down.
We’ve separated all of our processes out into three main areas – Sales, Operations, Marketing – as they relate to actually helping you buy or sell a business on our marketplace.
We’ll be adding more articles to the page over time as the need arises, so you can understand how everything works before you buy or sell with us.
You can check out the How It Works page here.
Dynamite Circle Bangkok (DCBKK)
We attended another successful DCBKK. It is always great to meet up with friends, talk with old colleagues, and network at a Dynamite Circle event. If you haven’t joined their group, they’re one of the best communities around for location-independent entrepreneurs.
They’re a great group of people and they’re all over the world, which means no matter where you go as a digital nomad, you’ll probably have a way to connect with a member of the DC.
Chiang Mai SEO (CMSEO)

Our friend Matt Diggity, over at DiggityMarketing.com, invited us to hangout at CMSEO once again. This year was the biggest year yet with over 500 talented SEOs flying in from all around the world to hear from some of the top minds practicing the art and science of SEO.
Our director of marketing, Gregory Elfrink (that’s me speaking in third person), got to take the stage and speak to them about how to play bigger with their content sites.
All right, enough third person. The main point of my speech was to talk about how you shouldn’t be looking at your site as a mere authority site anymore. If you want to achieve a 7-figure or even an 8-figure exit, start treating your site as a media company.
Trust me. I’ve been in and around the M&A space in online businesses long enough now to see the power of this mindset shift. There are companies playing on another level when it comes to their websites, and to be frank, their skill sets are probably not that much more advanced than many of you out there reading this right now.
Sellers World

We ended 2019 with another conference, this time dedicated to Amazon FBA sellers. We’ve been a fan of what Loz Green and Chad Wilton have been doing over at Affiliate World for some time now. When they came to us saying they wanted to throw a conference all about the Amazon FBA space, we were sold.
This was their first event and we hope they keep doing it as it was great fun. A lot of amazing entrepreneurs attended and tactical talks were had. I even got to meet an Amazon employee opening up the Thailand market.
It was a tiring day for our team, but we walked away with tons of new connections.
And I got to give a whole speech about how to go about buying your first Amazon FBA business. Plus, I emceed the whole day, introducing speakers to the stage.
It was a very tiring day!
But totally worth it.
Shiny Brand New Email Funnels
One of the big things we focused on in 2019 was setting up a new email infrastructure. As Hubspot users, we knew we were underutilizing this workhorse of a marketing automation machine. Even after our update, we’re probably still underutilizing it, to be honest.
Marketing automation enterprise software requires a course in and of itself for proper use at times!
Our marketing team has worked incredibly hard to bring these brand new email funnels to life. A couple years ago, we did a refresh of our emails, but that was really just an update for the ancient email funnels we had since around 2012-2013.
Much of our marketing funnel had to be removed completely and rebuilt entirely from scratch in 2019. Now, we have a funnel that actually knows we have a vetting team, a migration team and, most importantly, a sales team.
We’ve just implemented the new funnels this quarter, so we don’t have enough data yet to track how well they’re performing compared to our old data. But we’re very excited to see how they’ll perform. Early signs point to them increasing our submissions and depositors to the marketplace, which is a great thing to see after the effort we put into implementing them.
Right now, our funnels are set up to be more relevant for where a buyer or a seller currently is on their journey. A big focus for us in Q1 2020 will be to fill the top of our funnels with new subscribers now that we have something solid created for people who join our email list.
They are nowhere near our full vision, but a minimum viable product has finally been completed.
A More Social Empire in 2020
One thing we worked on in Q4 was a content repurposing plan. We produce tons of content, but it is far harder to keep up the content creation cycle than it is to just repurpose what we have. The fact that we don’t really do any repurposing outside of RMRB shows across all of our social channels.
So, we’re planning to up our game in 2020 and become more “social” as we try and implement the Gary Vee Content Slidedeck.
If you go through Gary’s deck, you’ll see the power that can be had with proper repurposing. One thing the slidedeck doesn’t talk about is just how hard it is to dial in real processes for getting the work done. If it was easy, everyone would be doing it, right?
We have so much content now across our podcasts, shows, live talks, webinars, and blog posts that we’re confident we can make it happen.
Speaking of being more social, if you’re on LinkedIn shoot me a connect request. If you haven’t done it yet, also go to our Youtube channel and subscribe. We’ll be publishing regular new content to both of these channels soon!
We Grew Our Team Again!
In 2019, we made a commitment to not hire anyone. When you scale your team size as dramatically as we did in 2018, you’re also going to scale inefficiencies. It is the dark side of scaling that entrepreneurs rarely ever talk about. Most just assume Growth Everywhere and Growth At All Costs are mantras to live by.
Not true. Those are dangerous mantras to live by if you’re not careful about how you grow.
That is why, for the majority of 2019, we’ve stayed focused on improving our processes, nurturing our current talent to new levels, and putting ourselves in an awesome position to start scaling up again in 2020.
Well, we’ve made it.
We’ve just brought on five new business analysts! Right now, as this post is being written, they’re being trained up in Lima, Peru. The next generation of Empire is being built to help you build even more wealth going forward in 2020, whether you’re buying a profitable asset or by exiting something great that you’ve built.
That Wraps Up Q4 of 2019!
And that’s a wrap!
There’s a lot of stuff here and, as always, we hope it inspires you. We like to write about what is going on with us, but it is even more important to us that this shows you just what is possible when you put in the hard work and sweat equity required to grow.
Here’s to the start of 2020. May you (and us) all play an even bigger, more fun, and interesting game this year.
