Our Q1 2017 Business Report – January, February, and March 2017
 Updated on February 29, 2020

We have been creating these reports for years to help our audience see that we believe in transparency. More importantly, these reports are a way for us to not just talk about the good stuff (and bad stuff) that has happened during the year, but also a way to inspire you to reach new heights in your own business.
It takes a lot of work to write these, but we love the effect they can have on people who read them, take action, and start leveling things up. It is hard to believe, but our first income report ever was way back in December 2010!
At the end of the day, these reports help us keep ourselves accountable.
They are a way to measure what we did (and whether it was good), determine where we are going, and figure out what we need to do next to achieve our goals. We make sure to share the lessons we’ve learned, from both our successes and failures.
Whether it is through the lessons we share or if it’s just a source of pure inspiration, we hope these reports will continue to help you achieve greater things in your online empire.
Let’s dive into the numbers.
Executive Summary – Q1 2017 Report
In Q1 2017, our company saw continued growth. Despite this quarter actually being better than last year’s Q1, we didn’t meet the goals we had set for ourselves at the beginning of the year.
Though we missed our targets, the marketplace-broker hybrid is still proving to be a growing system that our clients love to use over and over again when it comes to buying online businesses.
We’ll get into how we missed our targets after all the nitty-gritty details, but before we do, this graph shows how we have been doing quarter over quarter. As you can see, Q1 2017 still looks pretty good!

And here’s the graph that shows our marketplace sales trend, all-time:

Q1 2017 Review
Q1 Business Data
- Total Team Members: 26
- Customer Heroes: 12
- Managers: 6
- Deal Facilitators: 3
- Contractors: 5
- Email Subscribers: 34,106
- Podcast Downloads: 46,821
- Site Visits: 192,047
Q1 Revenue
- Brokered Site Sales: $2,745,657.58
- Listing Fees: $13,244.00
- Investor Program Raised: $0.00
- Investor Program Overall Earnings: $34,055.64
- Average Deal Size: $59,688.21
Q1 Gross Earnings
- Brokered Site Earnings: $374,577.43
- Listing Fees: $13,244.00
- Investor Program EF Earnings: $10,216.69
- Additional Revenue: $114.16
- Total: $398,152.28

Revenue Breakdown
Now let’s break down each individual section. This deep dive will help us figure out what is going on, and provides a lot more insight into where the growth or stagnation is coming from.
Brokered Site Revenue
We brokered 46 deals for $2,745,657.58 in Q1 2017.
That puts our total amount of revenue, for all time, at $19,238,690.20.
These numbers are exciting for us because we are still seeing a very nice trend of doing better with each quarter (you can see how we did in Q1 2016 for comparison here). Despite beating out Q1 2016 numbers, we didn’t meet our earnings goals in Q1 2017. Our original goal was to hit $3.6 million in Q1, and we ended up being $800,000 short of that goal.
We brought on three sales apprentices towards the end of last year that we hoped would help us meet the goal for this quarter. While they are doing a great job, it is possible the stagnation comes from the fact that our sales team was still ramping up, and finalizing larger deals just takes a longer time. We will have to spend more hours growing our connections, relationships, and negotiation skills as we continuously move into bigger deal sizes. Everything might not happen in a single quarter.
As you can see, average deal size is still something trending upwards on our platform:
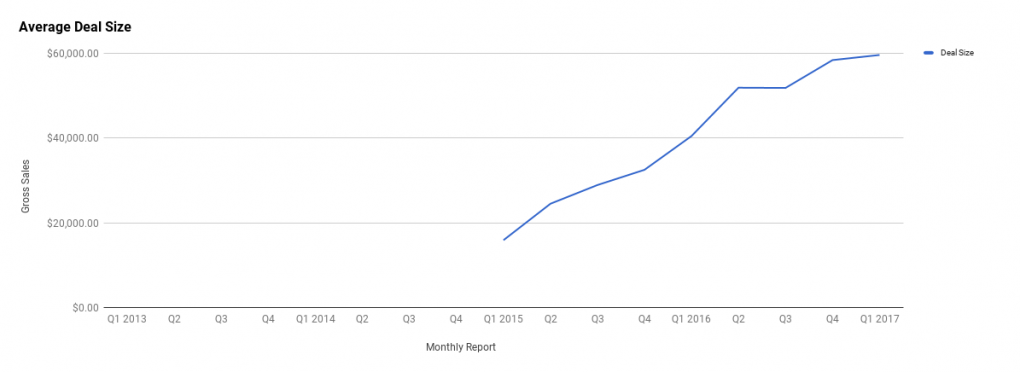
Our deal size saw incremental growth this quarter when compared to last quarter. In Q4 2016, the average deal size sat at $58,479.47, versus in Q1 2017, when our average deal size was $59,688.21. This incremental growth, two quarters back-to-back, is something that happened to us in Q1 and Q2 2016, as well. Back then, we made a jump of a few thousand dollars in average deal size, so hopefully, this same trend is a forecast of a large jump in average deal size coming our way!
It is important to remember that we take home only a small percentage of this revenue, since our actual earnings are just 15 percent of all the deals on our marketplace. Our earnings for Q1 2017 came out to be $374,577.43, which is a combination of the deals we closed this quarter, plus some earnouts in deals from previous quarters that are still running.
Website Listing Fees
Charging sellers to list their businesses on our marketplace is still something we see success with and benefits in doing. It saves our team a ton of time when it comes to vetting by having this small barrier of entry, and helps cover some of the costs and resources that go into vetting the businesses before they go live onto the marketplace. Ultimately, these listing fees benefit the buyers, because if a seller isn’t willing to pay a small listing fee, then there is likely something wrong with the website in the first place or maybe even with the seller themselves. It’s good for sellers because the fee weeds out a lot of competing listings; since many people refuse to pay the listing fee, sellers who do follow our process ultimately get more exposure for their listing.
Listing fees, combined with our six-month exclusivity deal, have continued to be a fantastic way to filter out serious sellers from tire kickers.
In Q1 2017, our listing fees hit $13,244.00, with a total of 52 people who paid the listing fee. The breakdown of new versus returning sellers looked like this:
- 11 New Sellers
- 41 Returning Sellers
This is a super interesting number to look at this quarter.
In the previous quarter, the numbers were nearly flopped, where we had 39 new marketplace sellers with 12 returning sellers. The numbers confirm we provide an excellent value to our audience, so much so that these sellers are trusting us to return again and again, to sell more of their digital assets and collect on a big payday exit.
While we want to continue to grow market share where new sellers find out about us, it is nice to know we have earned this much trust from our returning clients.
Investor Program
The investor program remains mainly dormant for us, at this point, while we review the past two years of performance to make the program even better going forward.
In Q1 2017, we officially split the brokerage from the investor side of things, introducing Empire Capital. However, Empire Capital is still very much in its beta phase. The main actions have been figuring out proper deal structuring and lining up effective operators for the businesses the fund will eventually invest in. Since Empire Capital is its own legitimate entity now, a large amount of time has been invested with lawyers to make sure we get the proper structure that will work for these investment funds from the very start.
The old investor program is still earning money, though! In Q1 2017, we earned $34,055.64 from the investments made last year.
If all goes well, our new investor program should be rolled out sometime in Q3 2017.
Additional Revenue
As time goes on, this additional revenue becomes less and less of a focus of our business. While we once promoted affiliate programs and products to earn revenue, we have largely stopped doing so. In fact, we promoted several courses in 2016 where we turned down being the affiliate, opting instead to put modules into those courses about buying and selling online businesses.
Since we also didn’t have any retreats last quarter, this additional revenue is very low compared to the last report, showing mainly legacy affiliate income we are earning at $114.15.
Traffic and Audience
Below are our numbers for site visits, podcast downloads, and email subscribers for Q1 2017.
Blog Traffic and Analytics
In Q1 2017, we received 192,047 site visits. The numbers show right around a 30,000-person increase in audience size compared to last quarter.

Content marketing remains the largest portion of traffic to our site, combined with targeted advertising. As more people in the internet marketing space sell their assets through our company, we are also getting more mentions by other industry and thought leaders, which is very helpful.
We shook up our editorial content a little bit by publishing only one general piece of content per week, combined with a more in-depth industry-related post every two weeks. This schedule has allowed our content manager to seek out other opportunities beyond just writing content, such as finding good joint ventures and participating more in various forums, groups, masterminds, and events we are connected to — in order to bring more potential clients closer to our brand.
That being said, our various traffic channels are still growing, as you can see below:

In almost every traffic channel, we have seen growth, with the most significant growth being in the organic search, direct, and email channels.
Our bounce rate remains good, with an average session being just over three minutes, and people visiting about three pages on our website before leaving. Minus the growth in our traffic channels, the statistics remain largely the same as last quarter.
As we continue to scale out the content and marketing arms of the company, we are hoping to continue to see even more growth in these channels.
Here are our Top Three Most Visited Pages on Empire Flippers:
Here are our Top Three Most Viewed Listings:
Here are our Top Three Most Viewed Pieces of Content in Q1 2017:
- The 11 Most Popular Online Business Models
- Debate: Dropshipping vs. Amazon FBA
- We Are Hiring a Customer Service Professional!
Podcast Downloads
We had a total of 46,821 podcast downloads in Q1 2017, which is a significant increase from Q4 2016, where we had just 29,474.
In Q1 2017, we did publish a few more podcasts, but ultimately we have been consistently inconsistent when it comes to publishing more audio content. This is something we are still working to resolve, but it is heartening to see so many people downloading our episodes, much of which is old content we published in previous quarters and even years ago.
This increase could have come from the fact that we hired a contractor to go through all of our old podcasts and upload them to our YouTube channel to help spread the old content. Alas, I believe there have been too few views on the YouTube channel front to warrant such a big increase in podcast downloads for this quarter. It is likely that there is more traffic to our main site, where our podcast is promoted, which helps visitors find out that we have a podcast and then they download it from there.

For our second podcast, The Web Equity Show, we got 11,595 podcast downloads in Q1 2017. This is a big increase in downloads from last quarter, where we had just 5,289, likely because we published the new season.

Email and Contacts
Email remains a huge component of our business. We use our email newsletter in almost every aspect of our business. As time goes on, we have begun to segment this list more effectively to offer a better experience for our subscribers, while optimizing our ability to bring traffic to our clients’ businesses for sale.
Currently, our email list is sitting at 34,106 active subscribers. Unfortunately, this report doesn’t cover the very start of January, as we had to re-create the report at that time. Going forward, all of our upcoming quarterly reports should reflect the entire quarter accurately.

Growth of our email list has been overall positive from Q4 2016 to present day, but of course there are not a lot of data yet for us to analyze, since this report is relatively new. This graph should have some more interesting numbers to discuss next quarter.
This is something we are going to eventually dive into a lot deeper, as we refine our entire email sequence and lead-capturing process.
We have already built some serious back-end processes through HubSpot, using various workflows and pipelines for both sellers and buyers.
Let us know what you are looking for:
Click here to share your buying interests.
Click here to share your selling interests.
We will be sure to send you content that matches more of your interests when it comes to new listings, blogs, podcasts, webinars, etc.
Customer Experience
Customer experience is something we consider to be mission-critical. Due to a massive amount of growth over the last year (yay!), good customer service has become more challenging to deliver (boo!). That is why this quarter, we hired a team of customer service professionals that could deliver on this promise. We wanted to hire these professionals in Q1 2017, but we didn’t actually bring them out to southeast Asia until Q2 2017.
Zendesk Support
Zendesk remains our main workbench when it comes to handling customer experiences. We have been using this ticketing system for years, as it is a good place to judge statistics and just how well we are doing.
Here are our numbers for Q1 2017:

Our first reply time has gone up since Q4 2016 from 5.54 hours to 6.21 hours due to growth-related growing pains. To be clear, this is a great problem to have, as we want to continue to grow by leaps and bounds, but it is also one we are really looking forward to fixing in order to give a better experience to our clients. We had 3,598 tickets in Q1 2017, compared to 3,103 in Q4 2016. We believe the amount of tickets is one of the biggest reasons why reply time is at this level, which is why we hired customer service professionals to help alleviate this load.
Like last quarter, our customer service remains “pretty good,” but with the introduction of customer service professionals and outlining a whole new overhaul of our customer service process, we are optimistic it will get way better later in 2017.
Customer Feedback
Q1 2017: 3,598 tickets, 3,568 solved tickets, 376 good ratings, 32 bad ratings
Here’s a look at some of the positive and negative feedback we received:

By and large, the negative feedback we received in Q1 2017 was a result of bad response times to questions from our customers. As I mentioned above, our customer service has really been strained as we’ve grown, and the screenshot above shows this perfectly. The “Bad” and the “Good” ratings show that the same customer agent can receive drastically different ratings, and it highlights why we really decided to focus on strengthening our customer service workflows to help us assist our clients better.
There are a few other negative feedback points outside of customer service; for example, marketing also got a bad mark because some sellers felt they weren’t given enough of a heads-up when it came to the changes being rolled out by the Amazon Associates program. We weren’t able to provide enough notice because we had to put every single Amazon Associate site back through our valuation process at the new affiliate rates that Amazon rolled out. You can read more about the Amazon Associates commission changes here. We definitely feel the seller’s pain, as some sites lost a large portion of their earnings and value overnight from Amazon’s changes. It was certainly a rough period for us as well, because we had to basically more than double our normal weekly valuation numbers as we repriced everything on our marketplace.
Looking ahead, we are very optimistic in where our customer service is ultimately going as we revamp our processes, hire more staff, and train more apprentices.

What Happened in Q1 2017?
The start of 2017 saw us starting to implement some new strategies, while also bringing our new sales team up-to-date on the company’s best practices.
Nomad Summit and Coworking Unconference

Our content manager and one of our deal facilitators flew out to Chiang Mai, Thailand, for a couple of weeks early in the year to attend two different conferences we sponsored. This is part of a new effort to get out there onto the conference circuit in force. After all, we now have one of the largest (if not the largest) team(s) in the brokerage industry. We anticipate that attending a lot of conferences in 2017 will be one way to successfully leverage our team.
The Nomad Summit and Coworking Unconference were both great successes. We got to meet the marketing team over at Thrive, speak on stage about our company, and meet a lot of really cool people. We even got a little bit of stage time at the Nomad Summit to talk about what we do, which was super effective in getting to meet a ton of people, once they realized what our booth was actually about!

The Coworking Unconference event wrapped up with Steve Munroe, one of the founders of an association called the Coworking Alliance of Asia Pacific, giving us his farewell speech of the seven-day event.

It was a challenge attending the events while still getting work done, but it was definitely worth it. We created a lot of quality leads that have now matured into sellers, and even some into buyers.
Justin Got Married!
Not really business related, but a number of our clients are also our friends, so we got to see a lot of familiar sellers and buyers — while having an awesome time — at Justin’s wedding and reception in Da Nang, Vietnam.
Our old buddy Matt Diggity even snuck into our Empire Flippers team picture.

One thing that is business related about the wedding is that Justin and Joe were gone for a lot of the day-to-day operations while preparing and actually having the wedding (and Justin was gone even longer from the mix, with his wife Aiza, as they went on their honeymoon).
This was, in a sense, a kind of test to see if the company would be able to run without the bosses for a little while.
It looks like we held down the fort. 🙂

As always, thank you to our audience for supporting us so much throughout our journeys. While these reports take time to write, they are rewarding, and (I hope) also inspiring for our audience to see what is really possible in a relatively short time if you put in the work.
Now back to you … what have you been working on? Let us know. We would love to hear about your exciting new projects!
