Our Q4 and 2016 in Review Business Report – October, November, December 2016
 Updated on February 29, 2020

We have been writing these reports for years, all in an effort to show transparency and inspire those in our community to keep building their businesses to new heights.
Believe it or not, our first report ever was way back in December 2010, over six years ago.
These reports have helped us keep ourselves accountable, measure the progress toward our goals, and serve as a good place to talk about lessons learned throughout each quarter. Since this is our Q4 report, it also includes numbers and reflections from 2016 as a whole.
It is our hope that these reports help you keep growing your online empire, either through inspiration or by talking about the lessons we learned as a fast-growing company –– one that recently landed on the Inc. 500 (we came in at 161!).
That being said, let’s dive into the numbers.
Executive Summary – Q4 2016 and Annual Report
The year 2016 was a huge year of growth for us, as you can see below.
We finished out Q4 2016 as our strongest quarter in the entire history of the company. Our marketplace-broker hybrid shows continuous success year after year, and that success is on a steady upward trend.

Q4 2016 and Annual Review
Q4 and Annual Business Data
- Total Team Members: 26
- Customer Heroes: 12
- Managers: 6
- Apprentices: 3
- Contractors: 5
- Email Subscribers: 31,588
- Site Visits: 162,482
- Average Deal Size: $58,479.47
Q4 Revenue
- Brokered Site Sales: $2,982,452.97
- Listing Fees: $12,747.00
- Investor Program Raised: $0.00
- Investor Program Overall Earnings: $34,552.68
Q4 Gross Earnings
- Brokered Site Earnings: $371,828.76
- Listing Fees: $12,747.00
- Investor Program EF Earnings: $10,365.81
- Additional Revenue: $194.59
- Total: $395,136.16
2016 Annual Revenue
- Brokered Site Sales: $9,974,989.19
- Listing Fees: $57,415.00
- Investor Program Raised: $0.00
- Investor Program Overall Earnings (Actual): $150,783.18
- Additional Revenue: $31,133.42
- Average Deal Size: $50,711.00
- Total: $9,974,989.19
2016 Annual Gross Earnings
- Brokered Site Earnings: $1,272,741.01
- Listing Fees: $57,415.00 (176 New, 54 Returning)
- Investor Program EF Earnings (Actual): $45,234.96
- Additional Revenue: $2,133.42
- Total: $1,377,522.39
Revenue Breakdown
While totals are nice, breaking down each individual section provides more in-depth insight into where our growth is coming from.
Brokered Site Revenue
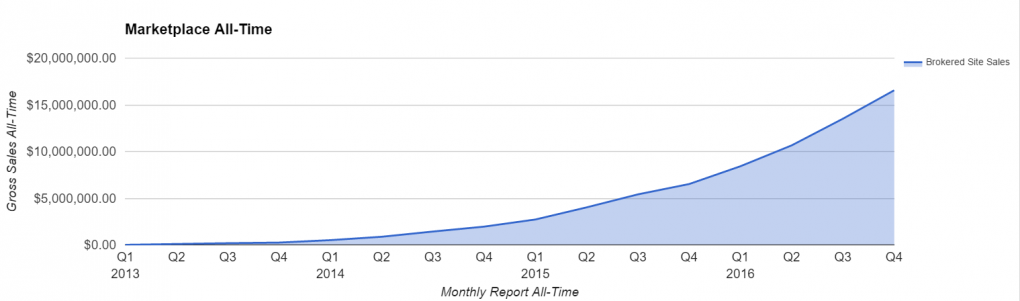
In Q4, we brokered a total of 51 deals for $2,982,452.97.
In 2016 overall, we brokered 196 deals for $9,974,989.19.
While we didn’t hit the $10 million mark in our final numbers for the year, we have seen some explosive growth this year in comparison to where we were two years ago or even a year ago, where in 2015 we had brokered a total of $4.5 million.
That is more than double the growth, and it put our all-time marketplace sales at over $16 million — which we’re pretty excited about!
These are big numbers, but it is important to bear in mind that we keep only a small part (our 15 percent commission fee) of every deal that comes through our marketplace.
Our Q4 gross earnings from commissions came out to $395,136.16, and our 2016 annual gross earnings from brokered commissions ended up at $1,272,741.01.
We attribute a lot of this growth to the scaling of our team. As many readers know, we are big believers in hiring apprentices, and in 2016 we aggressively expanded our team using this model — you can see the full team on our newly updated About Us page.
In 2016, we also had our first million dollar month in April, then proceeded to break that record with more million dollar months later in the year.
While the quantity of deals has steadily gone up, the most dramatic number to look at is the increase in the average size of our sales on the marketplace. In 2015, our average sale was $25,470.05, but in 2016, our average sale grew to $50,711.00 — almost double!
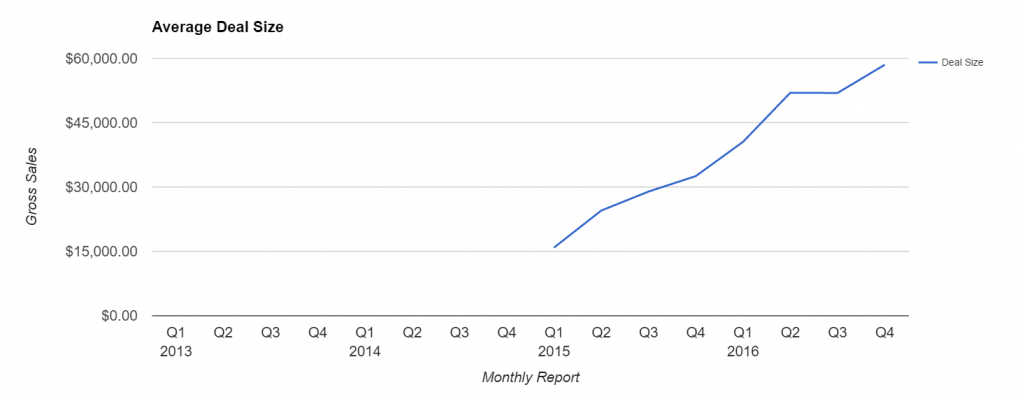
A lot of this growth can be attributed to our marketplace’s evolution from selling mainly AdSense and Amazon Affiliate businesses to selling online businesses built on a large diversity of online business models. Our team has grown not only in size, but in our skill set for brokering more complex ecommerce and SaaS businesses.
With 13 Amazon Fulfillment by Amazon (FBA) businesses sold on our marketplace within 2016, we have also become the industry leader for selling Amazon FBA businesses (we recently wrote an analysis of why Amazon FBA businesses are currently a buyer’s market, which you can read here).
Website Listing Fees
We have continued collecting listing fees from both repeat and new sellers, and while this revenue makes up less of our overall earnings, it still remains a great way to make sure our sellers are serious about selling their businesses, which is our primary concern.
We have found that the listing fees, when combined with our six-month exclusivity, have been an important filtering process in getting the highest quality sellers on our marketplace. Our listing fees in Q4 2016 were $12,844.00, just shy of $13,000.00, which is pretty consistent with Q2’s and Q3’s combined fees. For our 2016 annual total, we collected $57,413.00 in listing fees.
We had a total of:
- 39 New marketplace sellers
- 12 Returning marketplace sellers
In 2016, we had:
- 137 New marketplace sellers
- 40 Returning marketplace sellers
We’ve been ramping up our marketing efforts and should see this number continue to increase through 2017.
Investor Program
The investor program still remains mainly in its beta phase. In early 2015, we came up with this idea of packaging together multiple online businesses into portfolios into which investors could buy.
While we believe this idea to be a massive opportunity that will get more competitive in the future, we ran into some significant issues with our first investment round. These issues put dents in the fund, and most of our time with the investor program has been spent trying to recover.
In Q4, our investor program made $34,552.68 in gross revenue, with $0 raised for the quarter. Out of that gross revenue, we made $10,365.81 in net earnings, with the total for 2016 sitting at $150,783.18 in gross revenue.
Going forward in Q1 2017, we have made significant changes to our investor program. We will have a dedicated manager for the investment fund, as well as significantly change what kind of businesses we will invest in. We plan on having operators (external from the Empire Flippers brokerage) in control of each business to manage and grow it moving forward. These operators will be experienced in running and operating large businesses with the same business models as those in our investment fund.
We are very much still building out our investor program with the full intention of it being one of the best investment vehicles in the industry when it comes to online assets. If you want to learn more about our investment program, you can create an account stating your interest by clicking here.
Additional Revenue
In Q4, we earned an additional gross revenue of $11,194.59, with additional net earnings at $194.59. A large portion of this comes from the second Empire Retreat we held, which included a number of deductible expenses. For 2016, we earned a total of $31,133.42 in gross revenue, with $2,133.42 of that amount being earnings.
As with our last report, there is not that much to break down here. If additional revenue starts to pick up, we might break down this section further. For now, we will just continue to group it all together.
Traffic and Audience
Below are our numbers for site visits, podcast downloads, and email subscribers for Q4.
Blog Traffic and Analytics
In Q4 2016, we had a total of 162,458 visits to our blog, down a little from Q3. This drop is possibly due to the holiday season, during which people are out shopping and spending more time with their families, and are typically less interested in business.

Our total traffic for 2016 came to 605,393 visitors, with an increase in month by month traffic, despite a small penalty we received due to a spam attack on our support system in November and December (which has since been resolved).
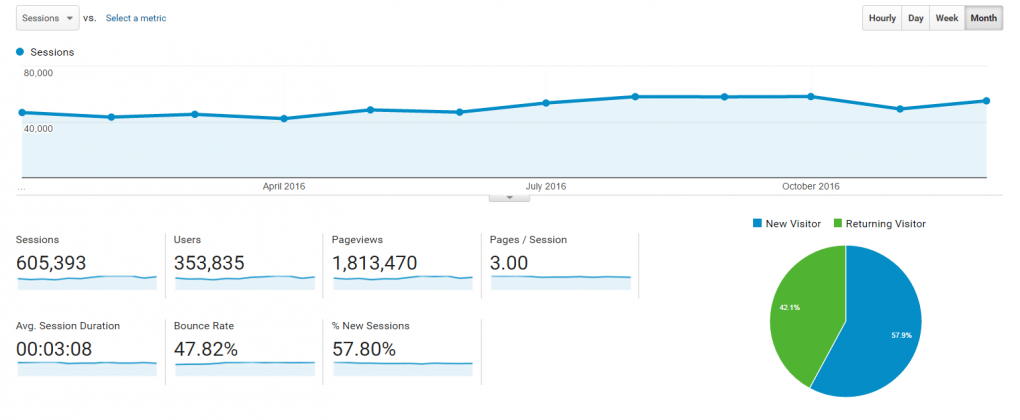
While our traffic was down from last quarter by a few thousand visitors, our overall traffic for the year is up from 2015 by 22 percent — a large part of which can be attributed to scaling our content and marketing teams so that producing content has become routine for us, as well as promoting that content in our various channels.
Speaking of various channels, here’s a breakdown of where the traffic is coming from.
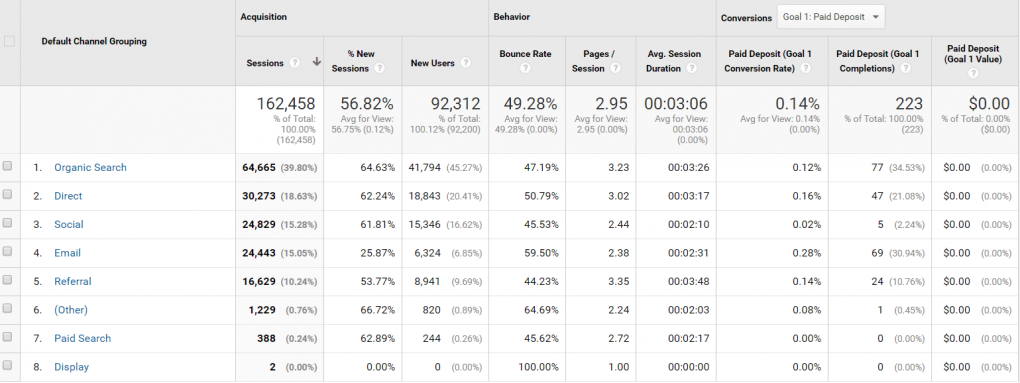
As you can see, the vast majority of our traffic still comes from organic search. This will likely continue to be the case as we keep upping our content game and audit old content to bring in more search volume.
One thing we are seeing is that our bounce rate is very good, with almost half of every single visitor visiting multiple pages throughout our website. Bounce rate is an important metric, and it is something we are always working to improve. One way we do this is by adding relevant content links to other pieces of content. We help our audience dive deeper into not just our marketplace, but also our brand; we offer an education on the industry through our blogs, podcasts, and YouTube videos.
Here are our Top 3 Pages on Empire Flippers:
No surprises there, honestly, as these three pages are the most linked to on our website, and will continue to be so.
Here are our Top 3 Most Viewed Listings for Q4:
- Listing #40520
- Listing #40612 (SOLD)
- Listing #40689 (SOLD)
And our Top 3 Pieces of Most Viewed Content for Q4:
- Debate: Dropshipping vs Amazon FBA
- The 11 Most Popular Online Business Models
- AdSense Account Disabled –– What Should You Do?
Here are our Top 3 Most Viewed Listings for 2016:
- Listing #40396 (SOLD)
- Listing #40520
- Listing #40612 (SOLD)
Here are our Top 3 Pieces of Most Viewed Content in 2016:
- Debate: Dropshipping vs. Amazon FBA
- AdSense Account Disabled
- EFP 121: Creating a Drop Ship Lifestyle With Anton Kraly
It is interesting (and encouraging!) to see our business model series starting to get more love, as we worked on that through Q2 and Q3. In the coming months, we are hopeful that more of our new content will start eclipsing our older content as those pieces age and start gaining more traffic in Google.
Of course, we have not been overly focused on keyword-rich content, instead focusing more on content that could benefit our users, even if there were no real keyword volumes associated with the piece. A good example of this is How to Win the Wire Race where we describe how some buyers leave money on credit with us so they are able to instantaneously buy listings before a competitor buyer’s wire is able to make it through.
Here are three newer pieces of content added in Q4 that are getting a lot of traffic:
- How to Make Next Year Your Best Ever (Seriously…)
- Building Websites That Local Business Owners & Marketers Are Hungry to Buy
- How to Make Your First Dollar Online With Zero Money
In 2016, we added a ton of new content. Here are three of the newer pieces that did the best in terms of traffic throughout the year:
- The 11 Most Popular Online Business Models
- How to Effectively Manage and Rank 50 Websites: A Guide to Scaling
- We’re Hiring a Sales Apprentice!
Podcast Downloads
For our primary Empire Flippers podcast, total downloads for Q4 were 29,474.
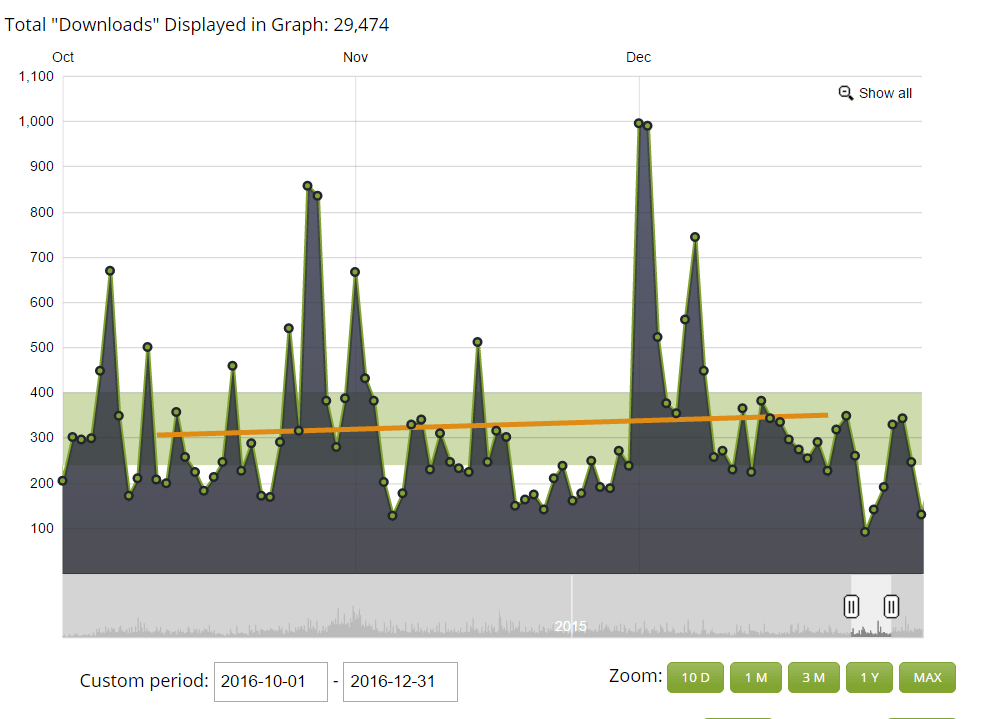
Our total Empire Flippers podcast downloads for 2016 were 122,916.

For our second podcast, “The Web Equity Show,” we had 5,289 downloads in Q4.

Total downloads for “The Web Equity Show” in 2016 were 23,960.

You can spot the obvious dip during the break between seasons on “The Web Equity Show.” We decided to do this second podcast with seasons in hopes that it would fix the consistency issues we have with our main podcast. So now we record the entirety of the podcasts season in one go in order to have expected “breaks.”
We are still continuing to grow our main podcast. We are looking to improve by putting out new episodes more routinely, feature more guests sharing their entrepreneurial stories, and discussing more industry news with our listeners.
By the way, Season 3 just recently kicked off. You can check out the show here.
Email and Contacts
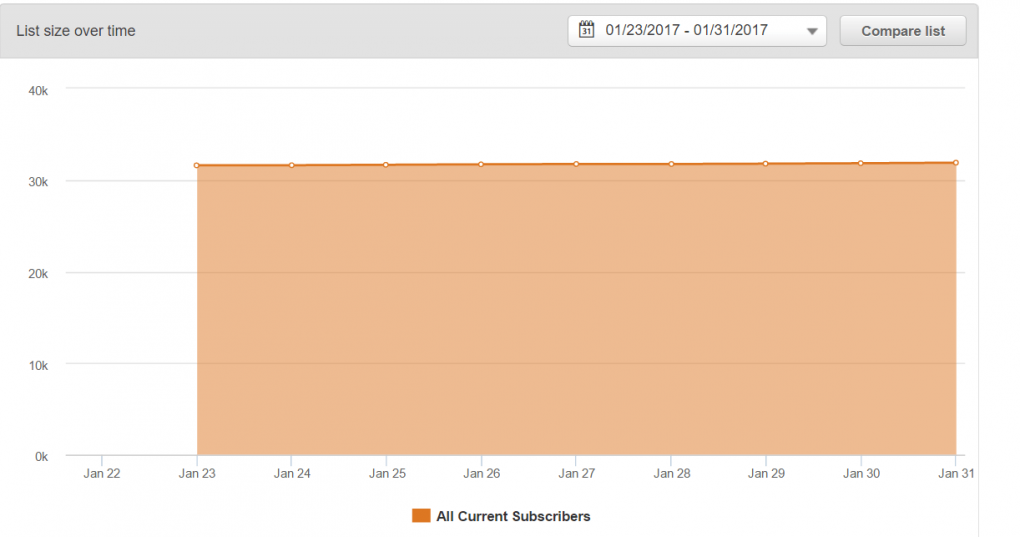
We recently created a new, more accurate, reporting system for all ACTIVE subscribers in our Hubspot email list. This list shows only how many subscribers we have opening up our emails and reading them, rather than including inactive subscribers or unsubscribers that once were tagged as subscribers.
Because this report was built on January 23, the data only go from there, and that is why the chart below runs from January 23 to January 31. Unfortunately, because of a flaw with our current Hubspot setup, this is the closest we can get to the end of 2016. But these numbers are pretty close to where we ended 2016 (and thus Q4), so we feel comfortable reporting these “as is.”
At the end of January, we had 33,881 contacts actively subscribed to our email lists –– breaking the 30,000 mark at last!
This new list should show some interesting trends going forward and will be pretty useful to our marketing team. In 2017, we plan to segment our email lists even further, creating brand new email follow-up funnels and implementing dynamic response in some cases (such as sending out an email to people that view the same listing multiple times, but have yet to make a deposit on it).
Want to let us know what you are looking for?
Click here to share your buying interests.
Click here to share your selling interests.
We will be sure to send you content that matches more of your interests when it comes to new listings, blogs, podcasts, webinars, etc.
Customer Experience
A large portion of our business is done with repeat customers and is heavily relationship based. After all, selling your business or buying a business are both very personal experiences. Tracking the customer experience becomes more and more important with each quarter, as our deals get bigger and demand more thorough attention.
A large majority of 2016 was spent putting out customer service fires as our team grappled with the growing ticket sizes, complexity of the tickets, and more clients in general. As mentioned in our Q3 2016 report, our customer service tickets went up a dramatic 75 percent.
We spent Q4 2016 determining the best way to handle this increase in tickets. We realized we needed to split our customer service and vetting departments within the company and increase the size of our team to handle this section of our business. The work we did in Q4 2016 led us to hiring three customer service apprentices in Q1 2017 to help us deal with this explosive growth.
Zendesk Support
Here are our numbers for Q4 2016:
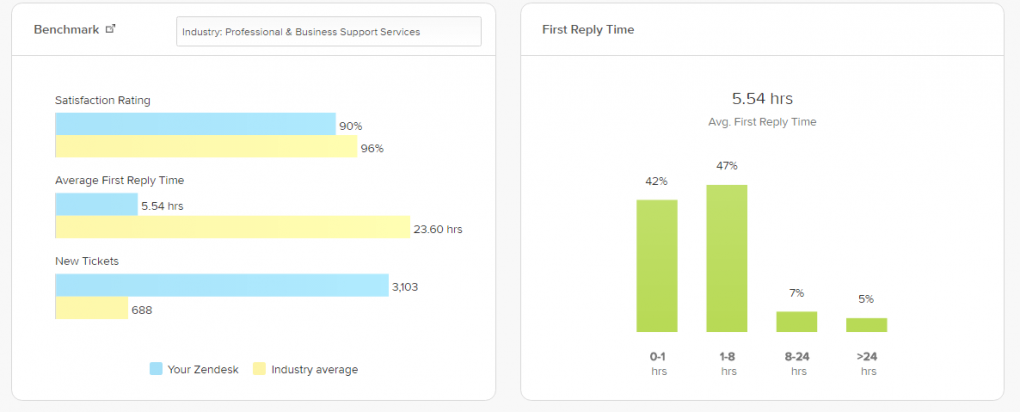
Unfortunately, our first reply time went up a bit from last quarter, where it was 5.18 hours, even though our new tickets actually dropped to 3,103 compared to Q3, when there were 3,561 new tickets. We are not sure why this happened, but it could be due to increasing complexity of deals as deals get bigger on our marketplace. The new customer service agents we are bringing on in Q1 2017 should be able to help solve this issue and help us give our customers even better service.
In 2016 overall, we had 12,842 tickets total, 1,185 good/satisfied tickets, and 120 bad/unsatisfied tickets.
Our customer service remains “pretty good,” but we are working on a major improvement in 2017 for our clients.
Customer Feedback
Q4 2016: 3,103 New Tickets, 3,115 Solved Tickets, 284 Good Ratings, 33 Bad Ratings
Here is a look at some of the positive and negative feedback we received:

Most of the negative feedback was from:
- Potential buyers that were frustrated with our deposit process
- Emails soliciting us to buy something or collaborate on some project (that we denied)
- Sellers that got a rejection notice during our vetting process
Most of this process is working exactly how we intended it to work. Our deposit process is unique within our industry, but it works great. If you are frustrated with our buyer process, we have written a few pieces explaining the benefits of a deposit process, which you can read here and here.
As far as the second issue goes, our team does a great job of filtering out most of these requests. When it comes to content opportunities, it is pretty easy for our content manager to spot the ones that might be worthwhile and the ones that are low quality. It is to be expected that someone who gets denied a collaboration opportunity might be a bit upset with us.
Likewise, sellers that get rejected from being able to go live on our marketplace, due to our vetting process, are not going to be happy and are more likely to leave negative feedback in our system.
In Q1 2017, we are looking to systemize and improve our processes in a huge way. Our three new apprentices, whose sole focus will be on our customer service and making sure our clients get world-class treatment, will make that happen.

What Happened in Q4 2016?
The last quarter of 2016 finished out the best year in our company’s history — and was full of events we attended.
Dynamite Circle’s Annual Event in Bangkok

Dynamite Circle’s annual event in Bangkok (DCBKK) was an awesome experience. We’ve been friends with Dan & Ian (the founders of the DC) since its creation, but this time was extra special. We were able to sponsor the opening party and offer some inspiring words to all the other location-independent entrepreneurs in attendance.
Not only that, but at this DCBKK, our entire team was present! (Booth included)
We sponsored the event, gave away our swag bags, and networked with more people at the event than ever before.
We also snuck away with many of the top thought leaders and influencers at the event for a private stretch limousine ride and a VIP night at the clubs. It was great for our team to meet these people, and, as always, it was great catching up with old friends.
In 2017, our team has grown, so there will be an even larger Empire Flippers presence for the next DCBKK. If you’re not in the DC and you qualify, we highly recommend joining the community; the connections alone make it a worthwhile membership.
Chiang Mai Meetup
Every four months or so, we get everyone on our management team together to come hang out and work with us for a month. While we bang out a lot of work in these four weeks, it is also a time we get to bond and have fun with each other while tackling major projects within our company.
This meetup in Chiang Mai, Thailand, was a bit strange, in a good way, in that we worked out of a coworking space due to not being able to find a place big enough for our entire team (both our managers and our three new salespeople we brought on board).
Three new salespeople (which we now call deal facilitators) came out to learn about our company culture and to get trained. Not only that, but they got to attend our second ever Empire’s Retreat (more on that below).
These meetups do a lot for our company:
- The business of business brokering is highly stressful and intense, and has a lot of moving parts. Bringing our team together in person helps build stronger coworking relationships, smooths over miscommunications, and helps solve problems in real time far quicker. While we love working remotely, working in person like this can really speed up our process in implementing new projects and completing those projects.
- We also hold our all-day quarterly strategy meeting during this period. It gives everyone an opportunity to talk about how they believe the company can improve, what we have accomplished, where we are going, and lay out new goals for the company.
- It’s just plain fun to be around our team. While we love the skills they bring to the table, our teammates are also our friends, and we enjoy hanging out with them.
We continue to see a ton of value in these meetups and plan to continue them through 2017 and beyond.
Brought on Three New Deal Facilitators
One of our big goals at the end of 2016 was to increase our sales staff. We’ve grown significantly in the last year, and with that our deal flow has also grown in size. We want to be able to provide the best service possible to our clients, give our clients the best shot at selling their businesses for the best price, and help our buyers get good deals on cash flowing digital assets.
We believe these three deal facilitators are going to make a huge difference in our company going forward, as they will be dedicated to just sales. This should make buying and selling businesses a much smoother process for our clients.
They flew out for our meetup in Chiang Mai, where they also started their training. After the meetup, they flew to Manila, Philippines, to do more intensive sales training with “Hot Money”, Joe Magnotti.
Obviously, we love building a 100 percent remote company where our employees can live anywhere they want, but we find that when you bring on new people, the fastest way to get them up to speed is by having them be there with you in person for the first few months.
Empire Retreat 2.0
Our second Empire Retreat also happened during Q4. Unlike the first retreat, this one took a bit more effort from our marketing team to sell out the tickets, most likely because it was close to DCBKK and many other events happening in Q4, not to mention the holiday season.
This was a big lesson learned for us, and it is unlikely we will hold the retreats in Q4 anymore due to it being high season for conferences. It was also very close to our last retreat, perhaps a bit too close.
Regardless of the issues, we sold out the tickets and booked two villas in Phuket, Thailand, for the event. This one went far smoother from an operational standpoint, because we already had the villas and the logistics figured out after lessons learned from the first retreat.
Currently, this event is a loss leader for us in that we don’t really make any money from it. We might eventually turn it into a profitable event for us, but for now it is a way to bring high-level influencers closer to our brand and be able to talk a deeper level of inside baseball with the entrepreneur community.
Plus, this event is extremely fun for us; between boat rides, the big night out, the masterminds, and meeting truly inspiring entrepreneurs doing cool things, we love the event.
Our guests also love it, with us already having one guest come to both events, and other guests saying it was the most valuable event they had attended all year (which was quite a humbling thing for us to hear).
We are currently promoting Empire Retreat 3.0. You can read the blog post about the event here, or buy a ticket here. Seating is limited, and we are really looking for only six-figure and up digital entrepreneurs to come to the event. If that’s you, hopefully we’ll see you in Phuket this July!
Diggity Mastermind
We were honored to be invited to help Matt Diggity over at Diggity Marketing host his high-level Search Engine Optimization (SEO) meetup. It was really cool getting to meet a bit of the “Who’s who” of SEO and we found a number of our clients in that meetup as well. We did this while in Chiang Mai and between the high-level masterminds, networking opportunities, and, of course, some drinks mixed in, it definitely was a highlight of our Chiang Mai meetup!
That wraps up what happened in Q4. Going forward, these quarterly reports should be available in a more timely manner as our Content Manager takes them over. (Thanks, Greg!)
As always, thank you to our audience for supporting us so much throughout our journeys. While these reports take time to write, they are rewarding, and I hope also inspiring for our audience out there in that they show what is really possible in a relatively short time if you put in the work.
Want to share the love? Tweet our report by clicking the button below!

Photo credit: bloomua
