Our Q2 and Q3 Business Report for 2016
 Updated on February 29, 2020

Welcome to our business report for Q2 & Q3, 2016!
First off, my apologies for getting this report out so late. We’ve had quite a few questions about it from some concerned partners, customers, etc. asking if we’re ok! We’re doing great, but it’s been one of those things at the bottom of the to-do list that got stuck, hehe.
First off, I should thank you for the continued support that has led to our massive growth in our company. Q2 and Q3 2016 were our best quarters ever, with sales at $2.2M and $2.8M, respectively.
This has allowed us to both expand our outreach through key marketing hires and our support staff so that we can continue to provide excellent service for both buyers and sellers on our platform.
Not everything has been great (or easy) though, so we’ll get into both the positives and negatives throughout this report.
As always, our purpose with these reports is to provide detailed transparency and highlight both our successes and failures with the hope that it helps you continue to build and grow your own online business. Additionally, it provides us with accountability and a public record we can review as the months and years go by.
We hope these reports encourage and inspire you as you continue to grow your online empire.
Executive Summary – Q2 & Q3 2016
Here’s a look at our month-by-month deals closed:
[wider_blog_insert img=”https://empireflippers.com/wp-content/uploads/2017/01/EF-Marketplace-Monthly-Q2-and-Q3-2016.png”][/wider_blog_insert]And our deals closed overall:
[wider_blog_insert img=”https://empireflippers.com/wp-content/uploads/2017/01/EF-Marketplace-Overall-Q2-and-Q3-2016.png”][/wider_blog_insert]Q2 2016
Business Data:
- Total Team: 22
- Customer Heroes: 10
- Management: 5
- Apprentices: 2
- Contractors: 5
- Email Subscribers: 24,657
- Site Visits: 137,884 (Last Quarter: 135,569)
Revenue:
- Brokered Sales: 43 Sales @ $2,233,890.77 (Last Quarter: $1,904.416.52)
- Listing Fees: $15,226.00 (48 New, 10 Returning)
- Investor Program Raised: $0.00
- Investor Program Overall Earnings (Actual): $20,730.69 (Last Quarter: $74,814.90)
- Additional/Other: $320.56 (Last Quarter: $1,085.80)
Total: $2,270,168.02
Earnings:
- Brokered Earnings: $318,253.62 (Last Quarter: $249,939.51)
- Listing Fees: $15,226.00 (48 New, 10 Returning)
- Investor Program EF Earnings (Actual): $6,219.21 (Last Quarter: $22,444.47)
- Additional/Other: $320.56 (Last Quarter: $1,085.80)
Gross Earnings: $340,019.39 (Last Quarter: $289,671.78)
Q3 2016
Business Data:
- Total Team: 24
- Customer Heroes: 12
- Management: 4
- Apprentices: 2
- Contractors: 6
- Email Subscribers: 27,492
- Site Visits: 169,482 (Last Quarter: 137,884)
Revenue:
- Brokered Sales: 55 Sales @ $2,854,228.93 (Last Quarter: $2,233,890.77)
- Listing Fees: $13,238.00 (40 New, 14 Returning)
- Investor Program Raised: $0.00
- Investor Program Overall Earnings (Actual): $20,684.91 (Last Quarter: $14,511.48)
- Additional/Other: $18,532.47 (Last Quarter: $320.56)
Total: $2,906,684.31
Earnings:
- Brokered Earnings: $332,719.12 (Last Quarter: $318,253.62)
- Listing Fees: $13,238.00 (40 New, 14 Returning)
- Investor Program EF Earnings (Actual): $6,205.47 (Last Quarter: $6,219.21)
- Additional/Other: $532.47 (Last Quarter: $320.56)
Gross Earnings: $352,695.06 (Last Quarter: $340,019.39)
Revenue Breakdown
Now that you’ve seen a snapshot of both quarters, let’s jump into the details to see exactly how it played out.
Brokered Sales
We closed a total of 98 deals for $5,088,119.70 combined in Q2 and Q3. Those sales brought in a combined $650,972.74 in fees to our company.
Our average deal size was right around $52K, which is significant because it was around $20K or so in 2015 and a little over $10K in 2014. It means that if we close more deals AND larger deals than we have the previous year, we can continue to have explosive growth.
This makes sense if you’ve been watching our marketplace. We’ve raised our minimums ($500/month for AdSense/Affiliate and $1K/month for eCommerce, Amazon FBA, SaaS etc. check out our business model series if you want to learn about those) which should continue to increase our average deal size. In the past we’d close dozens of 4-figure sales per month, drawing our average down. While we still made money, we realized a drain on resources and saw an opportunity to refocus our efforts on the 5-7 figure deals.
We’re on track to hit our $10M in sales this year, but will have to finalize the numbers in Q4 to see whether we make it or not.
Website Listing Fees
We made a total of $28,464.00 from listing fees in Q2/Q3, with 88 first-time listings and 24 repeat sellers)
This was pretty consistent with previous quarters, but we’ll need to step up our game heading into the next few quarters if we want continued growth in 2017.
While this is a great barrier for us and helps defray the costs of vetting new listings and sellers, we DO also accept discounted or free submissions from those in communities we’re connected with or know personally.
We’ve stepped up our marketing in Q2/Q3 which should improve our visibility and bring more buyers and sellers to our marketplace.
Investor Program
In late 2015, we started a beta test of our “investor program” – a process where we select and manage a portfolio of websites from our marketplace on behalf of investors.
We ran into some problems in 2016 that have put a real dent in expanding the investor program – at least until we can correct the issues and get back on track.
The investor program grossed $41,415.60 total in Q2/Q3, of which we received $12,424.68.
Most of our efforts to recover the portfolio to previous earnings in Q2/Q3 were ineffective, but we’ll make changes in Q4 that will, hopefully, get this back on track.
Even though this has (so far) not been nearly as successful as we would have liked, we’re still plugging away at it because the upside and opportunity is massive. We really believe that being able to put together “funds” of packaged online businesses will be extremely profitable (and competitive) in the coming years and we want to continue to work at it to see if we can get it right.
If you’d like more information about the investor program, sign up here.
Additional Revenue
We brought in a total of $853.03 through other channels in Q2/Q3. (Including random affiliates and legacy payments)
Note: We brought in an additional $18K in Q3 for a retreat we put together in Phuket, Thailand. I didn’t include this in our gross earnings as we actually lost money – more details on this below.
Not much to say here, really. If any additional revenue streams start to take off out of this I’ll likely break them out into their own section. For now, we’ll just continue to group everything else into this.
Traffic And Audience
Here’s what we’ve done in terms of site traffic, podcast downloads, and email subscribers for Q2/Q3 2016.
Blog Traffic & Analytics
We had a total of 137,884 visits in Q2 and 169,482 visits in Q3:
[wider_blog_insert img=”https://empireflippers.com/wp-content/uploads/2017/01/Q2-and-Q3-Google-Analytics-Overall.png”][/wider_blog_insert]Much of our increased traffic came from our doubling down on our marketing team and current channels. (More on that at the end of the report) Most of the traffic was from Google searches, direct traffic, email visits, and Facebook:

Our traffic was up 22% over the previous six months, which is encouraging.
Here are our Top 3 pages on Empire Flippers:
And here are our Top 3 listings in Q2/Q3:
Listing #40396 (Sold)
Listing #40517 (Sold)
And our Top 3 pieces of content for Q2/Q3 2016:
Debate: Dropshipping Vs. Amazon FBA
Podcast Interview: Anton w/ Dropship Lifestyle
We added quite a bit of newer content in Q2/Q3 as well, even if it didn’t break into our top 3. Here are the most popular pieces added recently:
How To Rank, Manage, And Scale 50+ Websites
We’re Hiring A Sales Apprentice
Behind The Scenes Building (And Selling) A $145K Amazon Affiliate Site
Podcast Downloads
We had a total of 63,484 podcast downloads in Q2/Q3 for the Empire Flippers podcast, which is down from previous quarters.
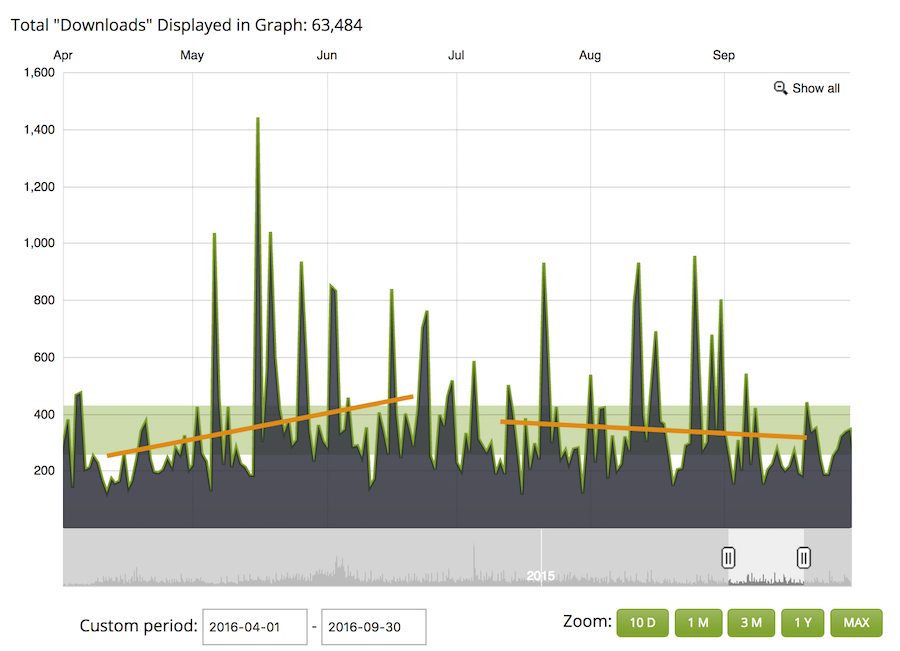
We had 15,294 podcast downloads from our second podcast, Web Equity Show.

A lack of consistency has been disappointing for fans of the Empire Flippers podcast, which is why we’ve broken up Web Equity Show into separate seasons. (To give ourselves an “expected” break!) We’re planning on publishing Season 3 of Web Equity Show in Q1 2017.
Emails & Contacts
Note: I believe I mis-reported our email subscribers for the previous quarter by including customers that aren’t still currently subscribed. I’ve corrected that in this report and will only display current active subscribers.
We ended Q2/Q3 with a total of 27,492 active email subscribers – well on our way to 30K.
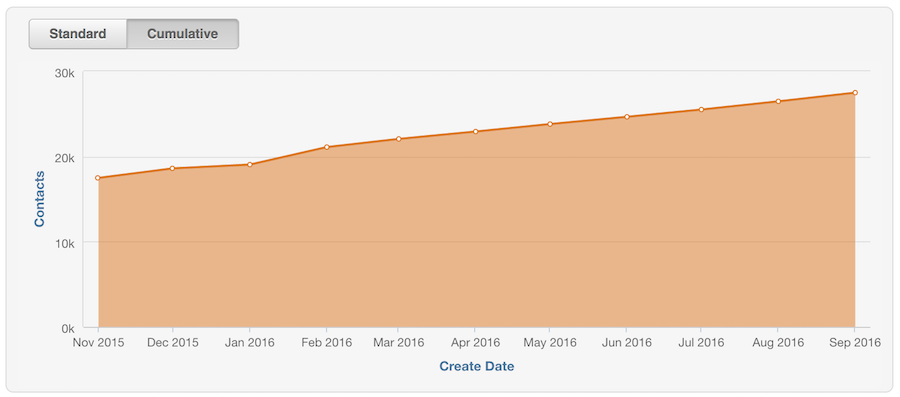
We’ve done quite a bit more segmenting of our list this year and will continue to do so. Aside from just splitting up buyer/seller interest, we’ve also gone into some depth about asking about things like budget, niche/interests, etc.
Want to let us know what you’re looking for?
Click here to share your buying interests.
Click here to share your selling interests.
We’ll be sure to send you content and listings that more closely match what you’re looking for when it comes to new listings, blog posts, podcasts, etc.
Customer Experience
As so much of our business is both relationship based and done with repeat customers, tracking the customer experience has become even more important to us and our company.
As excited as we’ve been about increasing our average deal size, those larger deals also come with increased complexity. Add to that the fact that our customer service tickets have gone up by 75% in the last year (2K – 3.5K tickets per quarter) and we’ve found this to be one of the challenging aspects to managing growth.
Much of our customer service efforts in Q2/Q3 2016 were spent putting out fires, plugging holes, and just keeping up. We’re realizing that splitting out our Customer Service team from our Vetting/Compliance team is something that will have to happen, along with bringing in some Customer Service management.
Zendesk Support
Here are our numbers for Q2:
And for Q3:
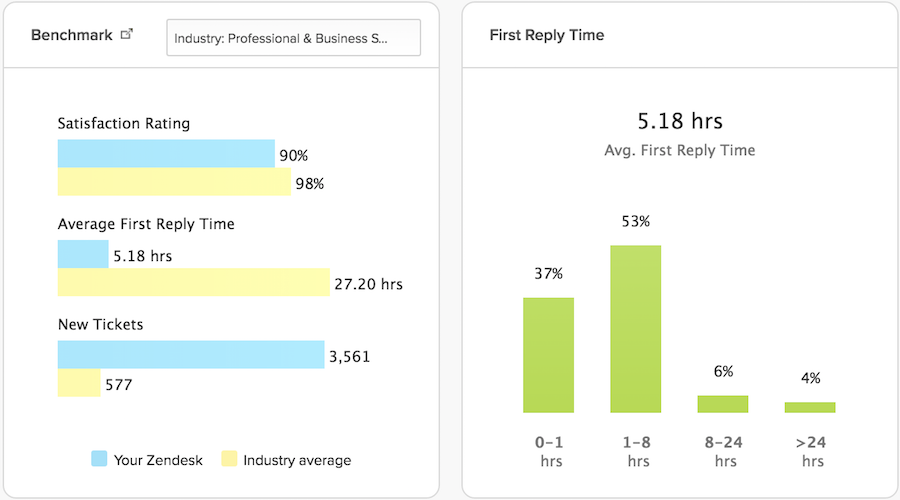
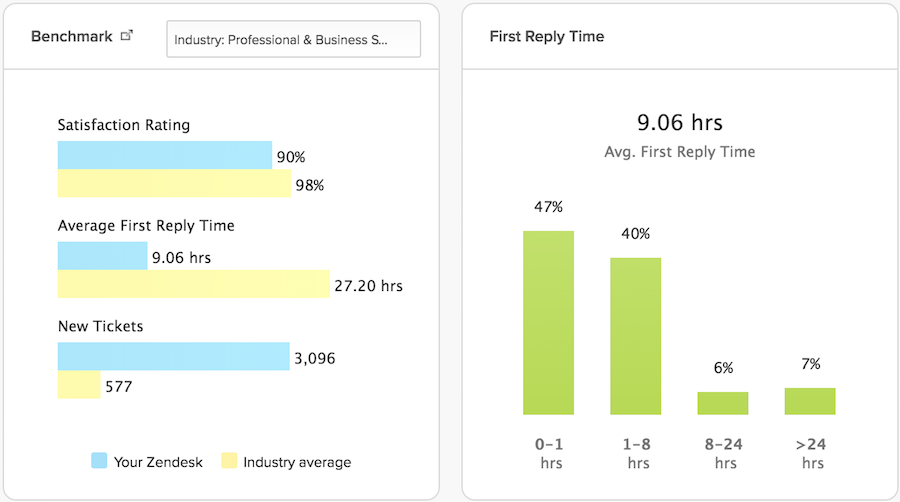
We saw significant increases in our first reply times from Q1 and again from Q2, but that’s mostly because Q1 was so dreadful.
Still – there was an 85% chance or better you’d get a response within 8 hours from our team, which isn’t bad compared to other email support I’ve experienced.
Customer Feedback
Note: We were only able to pull the first 90 days of each quarter due to limitations in Zendesk reporting.
Here’s a look by the numbers for both Q2 and Q3:
Q2, 2016: 3,096 total tickets, 275 good/satisfied responses, 32 bad/unsatisfied responses.
Q3, 2016: 3,561 total tickets, 311 good/satisfied responses, 30 bad/unsatisfied responses
Considering the fact we only had 2K tickets in Q3, 2015 and 2.6K tickets in Q4, 2015 – these are fairly massive increases in just under a year.
Here’s a look at some of the positive and negative responses from those tickets:

Most of the negative feedback was from:
- Potential buyers frustrated with our deposit process
- Sellers that were rejected during the vetting process
- Cold emails looking to sell us something or collaborate
For #2 and #3, we consider this “working as intended”. Of course sellers will be disappointed when we break the bad news and let them know we won’t be able to get them listed. Also, we’re happy to have our team acting as a buffer when it comes to cold emails, “opportunities”, etc.
For #1 above, the process is working as intended as well, but we also understand that we’re doing things different from how everyone else operates and how it’s traditionally done. There’s an educational piece to this that, once explained, makes sense to most potential buyers. This is typically best done over the phone, which is why our team is regularly setting up calls to discuss with prospective buyers. It also gives them an opportunity to walk new buyers through our process and better understand the model. We do have a couple of pieces of content that explain why we do our deposit system, which you can see here and here.

What Happened In Q2 & Q3 2016?
Six months covers a lot of ground! What we were up to? Here are the highlights:
1. EF Manager Meetup in Saigon, Vietnam – April, 2016
Three times a year we get our management team together for a month. We do this for a few reasons:
A) Our work can be high-stress and intense, so it helps for our team to build and strengthen personal relationships. It helps to smooth over the inevitable misunderstandings and disagreements that pop up.
B) We also hold our all-day quarterly strategy meeting. This gives everyone a seat at the table and insights (plus direct input) into the goals of the company.
C) They are ridiculously fun/rewarding.
We’re able to eat some good food together, like this brunch meetup at the Intercontinental in Saigon:

But a lot of the time we’re banging out the work.

Still, we were able to sneak away at the end of the month for a bit of fun in Hong Kong and Macau as well:

2. EF Manager Meetup in Phuket, Thailand – August, 2016
Our next management meetup was in Phuket Thailand, where we rented this awesome penthouse with a great ocean view (AirBnB link here):

The place was huge, which gave us plenty of room to stretch out and work. We were able to get quite a bit done, even with a few visitors we had coming down to Phuket to spend some time with our crew.
We actually split this month up with our first ever customer retreat, mentioned next.
3. Our First Customer Retreat in Phuket, Thailand – Aug 16-19
We spend quite a bit of time in exotic locations, but have never actually thrown an event for others to join us.
While sitting around in a lounge in Vietnam, Mike Swigunski (check out our About Us page if you’re not familiar) and I decided to change that! There was this amazing, 10-bedroom villa I’d been eyeing for a while on AirBnB that I wanted to rent. What better way to do that than to make it a business mastermind?
We pre-booked the place, threw up an order form with a ridiculously low price point ($1K), and had people sign up. We ended up having an amazing time with the masterminds, presentations, and extras we had setup. Check out the video here:
We brought in around $18K for the event, but it ended up costing us around $25K in total. No worries – the connections made and deals done will definitely make up for a $7K loss, without a doubt.
BIG thanks to Mike Swigunski for setting everything up! We had such a good time we decided to throw another one in Q4, heh. (Will mention in next quarter’s report) – you can read more about the first Empire’s Retreat here.
4. Landed On The INC 5,000 List At #161
We knew we’d been going through a period of tremendous growth, so I took a look at the requirements for the INC 5,000 and realized we had a pretty good shot at a solid position on the list.
We ended up filling out our application and after a few rounds of requesting information (CPA certification, tax returns, etc.) they told us we were approved! When they finally published the list, we were pretty excited to see ourselves in the top 500 fastest growing companies in the US – #161 in fact!
We actually found out at our mastermind retreat, so Mike snuck in an interesting announcement at the closing party:

One of the drawbacks to being on the list is the incredible number of people combing through the list as sales leads. We’ve had an insane amount of sales pitches come through this year…ugh…but the additional exposure was a worthwhile trade off.
That wraps up our Q2 and Q3 business report for 2016. There was quite a bit going on that I’ve left out, but we were pretty far behind and I wanted to get this out and published for you!
Our Q4 report will include some annual numbers for 2016 and more in-depth thoughts on our goals and longer-term projects going forward.
“New – Business Report for Q2 & Q3 2016 from the @empireflippers!”
Now – over to you. What have you been working on recently? Any successes/failures you’d like to share? Let us know in the comments!

Discussion
These are great numbers-good for you and your team!
Thanks Jody!
It’s been a pretty explosive last few quarters! We’re pretty excited to see where the future goes
Hello,
I have a branded and trademarked Amazon FBA business that I started last year. Can you tell me what buyers look for the most when buying these FBA businesses? I’d like to build it up a bit more, but I want to focus on what I can do to get It ready for sale. Any advice would be appreciated.
Kelly
One thing that we recommend is to outsource your quality control and inspection. The last thing buyers want to do is package the goods themselves to send off to the fulfillment warehouses. This is something A LOT of sellers don’t do or think about, but it is important. Many potential buyers are traveling the world, or in locations where they could not receive product to package themselves. By making this plug and play for the buyer, you might be adding an expense but you will ultimately be adding value to the business because you turn the business more into a system.
The more SOPs (Standard Operating Procedures) you have that details how to run the business, research new products, marketing strategies etc. the more appealing your business is going to be to a potential buyer as well.
Awesome stuff JC, I love these posts always inspiring!
Things are looking pretty great =)
Hope everything is going good over there at the Tropical MBA, Dan!
Thanks, man – appreciate it!