Q3 2019 Report – July, August, September
 Updated on March 16, 2020

It’s that time of the year again!
At the end of every quarter, we publish this report to let you know about how the company is doing, industry trends, and some (hopefully) helpful or inspirational advice for you in your business.
After all, we would not be here without your continued support of our brand and mission.
Q3 of 2019 has become the biggest quarter in our company’s history. The entirety of 2019, so far, has continued our hockey stick growth in terms of overall revenue. With the year almost over, we’ve started seeing some of the fruits of our behind-the-scenes labor.
One of the biggest fruits is something you can see right now in the top right corner of our website (if you’re on a desktop at least): our “login” button. Our team of talented engineers have been working thousands of hours to bring to you a better, more intuitive, and more functional marketplace to help you speed up your due diligence or reduce the time to actually exit your company.
If you haven’t registered for an account, you can do so here.
We have so many more exciting changes to reveal, so let’s dive into the heart of what went down in Q3.
Executive Summary: Q3 of 2019 Report
Let’s start with a look at our business data, revenue, and earnings.
Q1 of 2019 Business Data
Business Data
Total team members: 61
Founders: 2
Sales team members: 13
Marketing team members: 6
Operations team members: 29
Engineering team members: 7
Human resources team members: 1
Finance team members: 1
Contractors: 2
Email subscribers: 81,756
Podcast downloads: 65,590
Site visits: 330,123
Revenue
Brokered site sales: $14,345,345.68
Listing fees: $5,134.00
Additional/other revenue: $97.89
Average deal size: $186,303.19
Total revenue: $14,350,577.57
Earnings
Brokered site earnings: $1,605,701.08
Listing fees: $5,134.00
Additional revenue: $41.79
Total gross earnings: $1,610,876.87
Eight 7-Figure Businesses for Sale Right Now
- Listing #45787: An Amazon FBA business created in October 2016 covering the health and supplements niche, selling 30 SKUs on Amazon as well as maintaining a branded Shopify store featuring a strong social media presence. The business is valued at $3,606,409.
- Listing #44985: An Amazon FBA business created in August 2014 covering the electronics niche, featuring 55 SKUs selling across Amazon, Walmart, Newegg, and a branded Shopify store. The business is valued at $2,984,239.
- Listing #46444: An e-commerce and dropshipping business created in June 2014 covering the home niche. All orders are fulfilled by a 3PL company and the website has diverse traffic sources ranging from paid media to organic social. The business is valued at $1,723,560.
- Listing #44987: An affiliate business created in June 2017 covering the information niche. This custom-built site features over 40,000 coupon offers. The business is valued at $1,621,763
- Listing #46538: A SaaS created in January 2009 covering the business niche. This company is run with a virtual team of employees, boasting a good social media presence combined with a large email list. The business is valued at $1,494,109.
- Listing #46056: An Amazon FBA and e-commerce business created in March 2018. This trademarked business is part of Amazon’s Brand Registry 2.0 and it sells 4 different SKUs. The business is valued at $1,264,497.
- Listing #46603: An affiliate and display advertising business created in May 2012 offering information on a specific diet. Its primary source of traffic is social media. The business is valued at $1,139,495.
- Listing #46166: A 2-site ecommerce business created in January 2018 covering the apparel & accessories niche. This trademarked business has year-over-year growth and the majority of its traffic comes from social media. The business is valued at $1,063,882.
Revenue Breakdown
That’s a lot of data to take in, so let’s break it down a bit and talk about what we’re seeing happening on the marketplace right now.
Brokered Site Revenue
Below, you’ll see a graph of our marketplace revenue quarter by quarter. In the last few reports, we’ve seen a lumpy growth trend, but Q3 has changed that trend…pretty dramatically too.
You can see we continued our shot upwards from the start of 2019. Our revenue in Q3 was $14,350,577.57 compared to Q2’s $12,489,992.50.
This makes Q3 the 3rd quarter in a row where we hit or exceeded all of our company goals and expectations. A big part of that is our sales and operations team continuing to master their processes and serving our customers better than ever, while our marketing team has been building out bigger brand awareness in a strategic manner.

The graph below, display our brokered site sales through all-time gross sales and monthly reporting, shows the same information as above in a trendline:

As you can see, we’re still experiencing staggering upward growth. The best part about this growth is that we’re not even close to being done with some major milestone projects that are coming up in our pipeline.
We’re excited to see this growth, especially when combined with a few projects we’re working on behind the scenes to grow our brand even further.
Now, $14,350,577.57 in revenue is a huge accomplishment, but it is important to remember that we only keep a small percentage of that revenue as gross profit. When you take into account our actual earned commission, we had total gross profits in Q3 of $1,610,876.87, a solid 7.7% jump from our Q2 gross profits of $1,494,952.86.
Below, you can see the trend for our average deal size during Q3:

As you can see, our average deal size continues to trend upwards overall even if it went down slightly from Q2. For a long time, people have assumed we only sell “small deals”, when we are actually close to selling more 7-figure deals in a year than any other broker in our industry. In general, we have the most dealflow of any broker out there. Where a typical broker might list 3-10 new businesses per month, we tend to list 5-10 new listings per week.
If you have a 7-figure business you’re itching to cash out on, make sure you set up an exit planning call with us today.
It will take a while to change that small-deal perspective, but we’ll keep growing our average deal size regardless.
In Q3, we saw an average deal size of $186,303.19, which was slightly down from Q2’s $198,109.30, but both are significantly higher than the start of the year, when our Q1 average deal size was at $125,189.58.
Q2, on average, tends to be our highest quarter in terms of revenue when we look at our trends historically. In fact, our highest quarter ever before Q2 2019 was in Q2 2018, when our average deal size was $128,765.84.
Now that we’ve broken the threshold by a huge margin in these last two quarters, our prediction is that average deal size will stay relatively the same or slightly dip until Q2 2020, where we’ll see general to explosive growth in average deal size.
Business Listing Fees
Business listing fees have never been a major income source for us, and that has become even more evident as time has passed. When someone decides to sell their business with us, they pay a one-time $297 fee if they’re a first-time seller or a $97 fee if they’re a repeat seller.
In the past, this used to help with some of the vetting costs we incur, but now it really just serves as a tiny filter to separate the tire kickers from real motivated sellers.
In Q3, we earned $5,134.00 in listing fees from sellers who actually went live on our marketplace, since we refund the listing fee if a business doesn’t pass our vetting process. Our listing fees were down from Q2’s $8,704.00 and down further from the $14,135.00 we got in Q1. Part of the reason for this fall is that more sellers are getting free submissions in our marketplace because they engaged with an exit planning call. Those exit planning calls help us to review businesses, making sure of good fits for us before they reach the vetting stage.
As we continue to get more complicated 7-figure and 8-figure businesses while continuing to have the industry’s highest dealflow in the sub-7-figure range, we imagine that our listing fees will either fall slightly or stay relatively stable this quarter due to the more hands-on approach we take in helping you sell your business now.
In Q3, we brokered 77 deals altogether. That is more than Q2, where we sold 63 businesses, and just one less than Q1’s 78 deals.
Regarding specific listing fees, just 22 businesses paid a listing fee to us with 15 of those entrepreneurs being first-time sellers and the other 7 returning to our marketplace to exit their next business. This number doesn’t tell the whole story, since we routinely get 30+ new submissions per week of people wanting to sell their businesses with us. The actual number of businesses we listed for the quarter was the 90 businesses that were live on our marketplace during Q3.
Think about that: we listed more than one business for every single business day in the quarter.
While that is an impressive number, it is actually down from previous quarters. In Q2 2019, we listed 95 businesses, and in Q1 2019, we listed 119 businesses. In Q1 alone, we listed more businesses than there were days in any quarter of the year.
That is a testament to the power of our vetting team, who diligently went through over 373 businesses submitted to us in Q3 to see if those businesses had enough quality to be sold on our marketplace. Now that we’ve hired and expanded our vetting team further, we expect our listing numbers to be even higher in Q4.
All right, we’ve explored the revenue for the quarter. Let’s dive into what happened with our traffic and audience in Q3 2019.
Traffic and Audience
Blog Traffic and Analytics
Our blog remains one of our biggest drivers of traffic. When we first started, our entire site was just the blog. We grew from that into a blog that happened to have a marketplace, but nowadays, we’re a marketplace that happens to have a blog.
Still, our blog remains the most frequently updated in the industry, covering topics from hard-hitting technical case studies that showcase the emotional success stories of our customers. In addition, we have, and continue to work on, industry-leading data-backed research pieces to keep bringing more and more value to you.
So what happened in Q3? Take a look at our traffic graph for the quarter below:
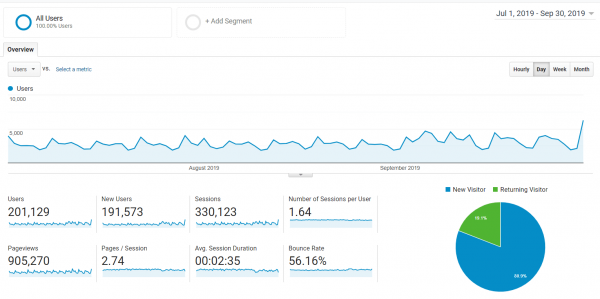
As you can see, we had 330,123 sessions with a strong spike near the end of the quarter. That spike was due to us launching our new marketplace, bringing in new users and more sessions as our traffic became more engaged with the new design.
We did slightly increase our traffic from Q2, from 320,931 sessions. A portion of this increase was caused by a focus towards on-page SEO. We probably won’t see most of the benefits from the work we did this quarter until somewhat into Q4, as we keep combing search engines for relevant keywords and keep winning various snippets.
One of the big things we did with on-page SEO was reduce our cannibalization by using various tools from Ahrefs to Screaming Frog, redirecting or combining relevant pages into a larger (and better) overall resource for the reader.
On-page SEO has been gaining a lot of popularity as the first “go to” SEO tactic used by professionals when they acquire an online asset, and so we wanted to try our own hand at it.
The results haven’t made a huge difference yet, but over time and with our new content production schedule, we believe on-page SEO will be a major winning factor for us to attract new traffic to the blog and thus, to our marketplace.
SEO is an important traffic channel for us, as you can see from this breakdown of our various traffic mediums:
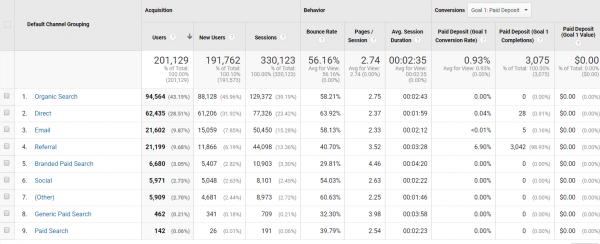
Our organic traffic technically dipped in Q3 with 94,564 users versus Q2’s 98,749 users. This is more due to seasonality rather than a slip in organic search, as Q3 tends to be a “quieter” quarter for traffic overall.
On the flip side, our direct traffic grew by leaps and bounds in Q3, with 62,435 users versus Q2’s 36,780 users. A big part of this was from increased brand exposure. As we keep marketing ourselves in channels that don’t have the best tracking in place (i.e., conferences), it is likely that our direct channel will continue to grow. The direct channel specifically is forecast to have more leaps in coming quarters as a few “secretive” long-term projects we’re working on start to roll out.
Email and referral traffic were almost equal in this quarter compared to the last. Typically, referrals are slightly higher for us than email. Our prediction is that email will continue to creep up slightly, especially as we finish with our marketing refresh. We’re implementing entirely new email marketing funnels for our users that make more sense with where they are on their buying journeys.
Overall, we’re pretty happy with our current traffic. It is always growing steadily, which suits us just fine. But where has all that traffic been going?
Here are our top three most viewed pages:
Here are our top three most viewed listings:
- (SOLD)Listing #46500: An Amazon Associate site valued at $22,353.
- Listing #45787: An Amazon FBA business valued at $3,606,409.
- (SOLD)Listing #45958: An Amazon FBA business valued at $48,388.
Here are our top three most viewed pieces of content:
- Top 10 Affiliate Networks and Programs That Aren’t Amazon in 2019
- The Most Popular Online Business Models
- The Lead Gen Business Model Explained
Here are our top three most viewed recent pieces of content:
- 2019 Online Business Trends for Buying & Selling
- 21 Ways to Sell Your SaaS Product to More Customers with Less Time
- [Case Study] How to 4x Your Revenue with Paid Traffic in Less Than 90 Days
If you want access to one of our top pieces of content though, you’ll need to join our mailing list so you can download our State of the Industry Report. This 83-page report analyzes close to 500 businesses bought and sold on our marketplace over a 2-year period. We do a deep dive analysis on what trends have come about, where things are going, and how you can take advantage of the trends whether you’re a buyer or a seller.
Podcasts and Shows
The podcast medium is one of our favorite mediums. The medium itself supports casual long-form, yet in-depth, conversations. It is the exact kind of content we absolutely love to produce, allowing us to reach our audience at different points of their day. After all, people are more likely to listen to a podcast when they’re at the gym than they are to read a blog post.
So what went down in Q3 across our various shows? Let’s explore.
The Empire Flippers Show
The Empire Flippers show has remained our flagship show for years. If you’ve never listened to it before, it features either our co-founders, Justin Cooke and Joe Magnotti, discussing a business topic in depth or Justin interviewing another entrepreneur.
Over the years, this podcast has helped us build and connect to a large audience, making our brand somewhat of a celebrity in the digital nomad circles.
Here are the download stats for Q3:

The Empire Show has long been plagued with an inconsistent publishing schedule, which hurt our overall download trends. But in Q3, we started publishing relatively consistently for the first time in a long time, and the gains in downloads are shown clearly in the graph above.
We finished Q3 with 58,442 downloads, more than our other two shows combined by a wide margin.
In comparison, we managed only 19,881 downloads in Q2, which was slightly up from the 17,792 downloads of Q1. We have typically hovered around this 15,000 to 20,000 download mark during standard publishing quarters, but through the power of consistent publishing, we were able to almost triple our downloads.
It is exciting to see such a huge effect from the work being done and it is something we’re hoping to maintain.
You can give the Empire Show a listen here or anywhere you download your podcast.
If you like the show, we’d love to get a review as it helps us spread the message!
The Web Equity Show
The Web Equity Show is a bit different from your normal podcast. Instead of interviewing guests, the show consists of co-founders Justin Cooke and Ace Chapman talking about different aspects of buying and selling online businesses.
Instead of rolling out an episode at a time, we plan entire seasons for this show. The show archives itself as one of the best continuous education content pieces in our entire industry as it walks you step-by-step through the process, whether you’re a seller or a buyer or even a fund raising capital to acquire businesses.
We haven’t produced a new season in a while, and no new plans have been announced just yet for another. That being said, the archives themselves are worth their weight in gold for someone just getting started in our space.
You can check out our downloads for Q3 below:
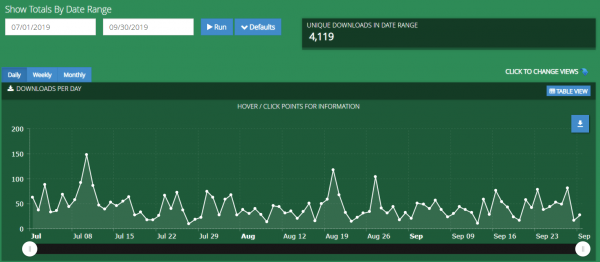
We had 4,119 downloads for the quarter, which is a bit lower than the 5,380 downloads in Q2. The drop in downloads was purely from a lack of new episodes, but over 4,000 new people have found, listened to, and enjoyed the show by finding us through various organic channels, which is great from a marketing perspective on our part.
If you’ve never listened to the Web Equity podcast, click here to listen and leave us a review if you enjoy the show.
The Real Money Real Business (RMRB)
The RMRB Show began as a way for us to repurpose our best seller interviews from YouTube. If you don’t know this, any business that is worth over $45,000 gets an interview from our marketing team discussing the business they’re selling.
We noticed that while many people loved these interviews, they didn’t want to sit down and watch the videos on YouTube. Instead, they wanted the content in a podcast format, allowing them to listen in whether driving or at the gym and letting them glean knowledge from successful entrepreneurs down in the trenches with them, building profitable businesses.
Right now, the RMRB podcast is on a short hiatus. Our main show host, Jake Davis, left the company and our new hires in the marketing department will be taking the reins in the coming weeks with a brand new version of the show, one we hope will be even better than its old incarnation.
The unique selling proposition of this podcast is that we actually know what these businesses make, and many times, we even helped to create their profit and loss reports before they were listed on our marketplace.
In the future, we’ll be featuring many different Empire voices to host the show and add some extra golden nuggets within the show itself, differentiating them a bit more from our traditional seller interviews.
You can see this podcast’s downloads for Q3 below:

In Q3, we had 3,029 downloads compared to 5,316 downloads in Q2. The drop makes sense, mirroring the issue the Web Equity Show is currently facing: a lack of new episodes. We expect this number to shoot back up to the 4,000-6,000 range in the coming quarter, once we re-launch RMRB with our new hires.
Never listened to the show before? Click here to listen and leave a review if you like what you hear.
Email and Contacts
Email remains one of our most powerful marketing channels. While we love content marketing, organic traffic, and other marketing mediums, it’s our email list that we prize the most.
At the end of the day, you own your email list. You’ll never own the wayward ways of Google nor Facebook’s cost per click, but you do own how you nurture and build that email list into customers and brand evangelists.
It is an exciting time for our email. We’ve worked hard behind the scenes these last few months to create brand new marketing funnels for all of our lists. These new funnels help our customers even more by educating them about our processes, featuring powerful in-depth content, and helping them schedule meetings with our business analysts.
At the time of this writing, the new email funnels should be implemented in about three weeks’ time.
Right now, our email list has 81,950 active subscribers that are moving through various nurturing funnels. That is up from Q2, where we had 79,956 subscribers.
Similar to our organic traffic, it is rare for us to see big spikes in our subscribers. Instead, we have slow-moving growth that continues to snowball in a positive direction every month. We are hoping to be able to increase subscribers by a bit more this quarter though, using our new email funnels and various new incentives to attract more people into our funnels and, thus, to our marketplace as well.

When you look at this graph on a quarterly basis, it feels very stagnant, even though there is quite a bit of growth here. A better picture of how our list size has grown over time is visible if you zoom out a bit and look at the all-time growth chart:
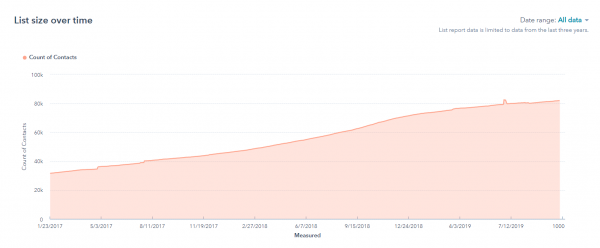
We started tracking our subscribers on Hubspot back in 2017. Since that time, you can see a clear steady growth in the right direction with almost no big spikes. We had a couple of bumps over the years as a piece of content went viral, but otherwise, we have stayed consistent month in and month out when it comes to subscriber base growth.
All right, enough about email. Let’s dive into the actual experience our customers have when they decide to sell their business with us or buy a business off our marketplace.
Customer Experience
Providing an excellent customer experience is one of our #1 priorities. Buying or selling a business, even if it’s just one of many for you, is a stressful process. Even when everything goes perfectly smooth, stressful situations are always lurking in the shadows.
That is why we are so committed to make it as easy, transparent, and user-friendly as possible for you. We want to help you through the steps, get you across the finish line, and let you enjoy your new asset or sudden windfall of capital you just received.
So what did our customers actually have to say about us? Take a look below:
Customer Feedback

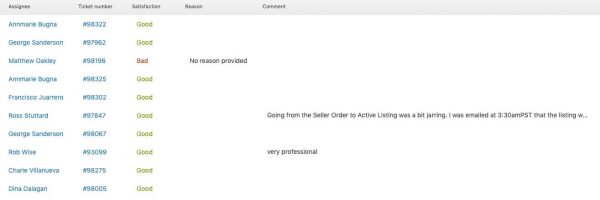
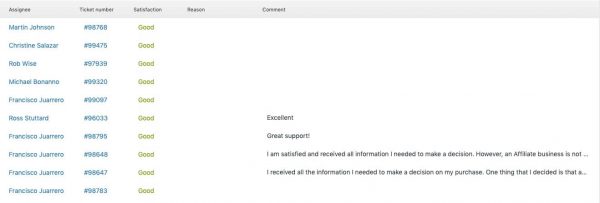
As you can see, the vast majority of our customers were pretty happy with us. The few negative complaints we got were related to sellers wanting much higher valuations for their businesses than we were willing to offer. It’s always a fine balance there, but as the market leader when it comes to selling profitable online businesses, we have the most up-to-date data of anyone around when it comes to actually pricing these assets to attract high-quality investors while still providing a lucrative exit for sellers.
You might notice that we didn’t include our normal Zendesk report card graphs this quarter. In the past, these were good metrics to judge our customer service on, but with all the changes to our internal processes of how we use Zendesk, that is no longer the case. We’ve retired the Zendesk report card for this very reason, but we’ll keep showing you actual customer feedback as part of our mission and commitment to transparency for you and the rest of our audience.
What Happened in Q3 of 2019?
So what actually did happen in Q3?
Well, quite a lot. Let’s dive right into the news and updates section.
New Marketplace Launch Begins
The biggest news of the quarter, and something truly revolutionary for us, is the launch of our new marketplace. We had a webinar a couple weeks ago announcing the marketplace we’ve been working on behind the scenes for the last year. The webinar got amazing feedback, with both buyers and sellers excited with what they got to see.
If you didn’t catch that webinar, you can watch the replay here or just click the video below:
Click Here to Register for Our New Marketplace
The new marketplace is going to speed up your ability to do due diligence. One of the big benefits of using a broker is that we help you cut through the noise. Instead of having to spend weeks or even months looking for dealflow before qualifying the deals you do find, you can use our marketplace to find vetted profitable businesses ready for buying.
Our old marketplace had a very limited sorting and filtering option, which meant that while we did cut down on due diligence time, you were still spending hours filtering through our marketplace.
No more.
What used to take hours to do on our marketplace now takes mere minutes.
See a business you like? Add that business to your watchlist for when you’re ready to start a deeper due diligence dive.
If you haven’t registered yet for our new marketplace, click here to register today.
Buyer Persona Quiz Created
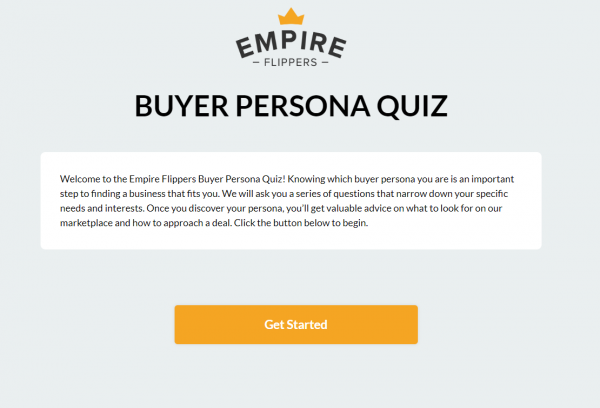
We actually created this a while back, but we didn’t roll out its promotion until Q3. Our buyer persona quiz asks you a few simple questions that helps determine where you are on your buying journey.
It can help you identify what kind of buyer you are and, ultimately, what kind of businesses might make the most sense to you. We have several different buyer personas that we use in our company marketing and when helping buyers on our marketplace to select the right business for them.
Ever wondered what kind of buyer you are?
Affiliate World (AW) Barcelona
We sent a crew over to Barcelona, Spain, to network with some of the top affiliate marketers in the world. We got to meet brand new people and also got to hang out with some old friends.
We’ll be attending AW Asia in Q4, but if you haven’t heard yet, AW is putting on a Seller World conference the day after AW. The Seller World conference is focused on Amazon FBA entrepreneurs and I’ll be there personally, giving a speech on how to go about buying an Amazon FBA business. You can check out the event’s details here.
DCx Budapest
Dynamite Circle (DC) continues to launch smaller satellite events around the world. This time, we went and networked with old friends in Budapest. It’s always great connecting with the DC, as our two companies have grown up with each other in many ways. We have tons of friends in the community and always love giving back to them when we can.
SaaS Stock
This was our first year attending SaaS Stock, one of the leading conferences when it comes to the SaaS business model. While it was our first time there, we actually had several customers and fans at the event and got to catch up with them.
All the while, we got to meet some impressive SaaS entrepreneurs and continued to build relationships in the space as we help SaaS entrepreneurs exit their businesses with the support of our pool of ever-hungry investors.
Dropship Lifestyle Retreat

Our Director of Operations, Andy Allaway, attended the Dropship Lifestyle Retreat in Prague. If you’re not familiar with Dropship Lifestyle, it is the brain-child of Anton Kraly, one of the thought-leaders on the dropshipping business model.
We’ve helped many of his students make successful exits with the stores they’ve built under his mentorship, and we were happy to show some of the major things to watch out for when preparing a dropshipping store for sale.
New Blog Redesign Launched!

The next big announcement is something you’ve probably already noticed…we’ve launched a brand new blog design!
This has long been in the works. Our old design was good for what it was, but it made navigating the blog to specific types of content next to impossible. We’ve now grouped various posts in themed categories to make your life easier when it comes to finding the kind of content you want to read.
We’re hoping this will improve the user experience overall.
We’re also right in the midst of launching an on-boarding section filled with articles and videos describing our various processes in detail. If you have been on the sidelines, wanting more information on how we do things before actually buying or selling with us, then keep an eye out for our Getting Started section. It should be launched and ready for you before the end of the month.
Empire Retreat 5.0
We held our fifth Empire Retreat!
It seems like just yesterday when our team was sitting in a hotel lobby in Saigon, Vietnam, and dreamt an idea of bringing together online entrepreneurs from all over the world to have a weekend of networking and fun together.
And yet, here we are.
We had many people returning for their third time, effectively making it a tie between six people as to who has attended the event the most. As always, we had a blast connecting with these talented entrepreneurs.
The retreat sold out so quickly though, so we will definitely be raising prices for next year. If you’re not on our email list yet, make sure you subscribe so you get the first early bird emails for the lowest price point to come join us next year in Phuket, Thailand. If you’re not on our email list, you can get on it by taking our buyer persona quiz or by filling our valuation tool that will give you an automated valuation for your business.
New Hires in Vetting, Migrations, and Marketing
We grew again!
We’ve hired three new members for the vetting team, another member for the migrations team, and two more members of the marketing team.
This year, we had almost zero plans to grow the team, but business needs forced our hand. We just had too many people submitting their businesses for sale and had to expand to handle the entire volume. In marketing, we’re excited to have hired two new content specialists, so we can continue producing high-quality in-depth content pieces for you backed up with real data from our marketplace.
Keep an eye out. A new generation of Empire employees are being trained and will be helping you with your buying and selling decisions soon!
In addition, we’re still hiring for another position. If you’re a developer or coder, our engineering department wants to talk to you.
Check out our job hiring post for a Full Stack Senior Level Engineer here.
If you’d like to see the new faces of Empire Flippers (or just all of our faces in general), check out our About Us page.
Broke $100 Million in Deals

Perhaps one of the biggest accomplishments of Q3 was the fact that we passed the $100 million mark in deals sold on our marketplace. This was a huge accomplishment for us. It was only a few short years ago when we thought the possibility of reaching $30 million in completed deals seemed like an unattainable goal.
And yet, here we are.
The deals came in so quickly at the end of Q3 that, when our marketing team suggested we do a campaign to celebrate when we pass the $100 million mark, we had to inform them we had passed that mark hours before Q3 had ended. We jumped from $98 million in deals sold to $101 million in less than a 24-hour period.
It was an intense frenzy of deal closing by our team, and a big shoutout goes to our sales team who really came together to push for the milestone at the end of the quarter.
While the $200 million milestone is far away, we’re confident that we’ll eventually hit it. If you want to follow along with how well we’re doing, then check out our “report card” over at our scoreboard to see real time numbers updated as they happen.
And that’s a wrap!
A lot went down in Q3, a lot of amazing milestones were crossed, and plenty of talented new members joined the team in the process. We’re excited with what both the near- and long-term future will bring to us, where even bigger milestones await for us to hit.
Hopefully, you found this report helpful and inspirational for you in your business. One of the big reasons we write this is not to brag about what we’ve done, but rather to show you what can be done. When you roll up your sleeves, focus on one business, and put in the sweat equity to make it happen, truly big things can unfold for you.
All you have to do is start taking the steps in the right direction to begin.
How was your quarter? What did you accomplish? What challenges did you overcome?
We’d love to hear it in the comments below.
If you’ve yet to register for our new marketplace, you can click here to sign up.
Maybe you’re ready to sell your business to make Q4 a highly profitable one for you? If that’s the case, feel free to submit your business for sale here.
