Q4 2020 Report—October, November, December
 Updated on February 18, 2021

It’s that time of the year again!
While it’s been a challenging year for many of us personally, it’s also been one of the best years for many of our entrepreneur friends and their businesses, including ours.
If you’ve been following along for some time, you know we like to write these quarterly reports throughout the year as part of our commitment to being transparent.
We try to provide some balance in that we want to show you both our successes and failures along the way. At times this can come across a little braggy – particularly when so many have had such a rough year, both professionally and personally. I want to be sensitive to that, but also make sure we share everything that’s going on in the business.
We do these reports as a way to help you get a better sense of the market and to show you what is possible in the world of online business when you roll up your sleeves and go to work.
So, let’s dive into what happened in both Q4 and 2020 overall.
We’ll start with a look at our business data, revenue, and earnings before breaking each of these down further.
Q4 of 2020 Business Data
Total team members: 71
Founders: 2
Sales team members: 16
Marketing team members: 8
Operations team members: 30
Engineering team members: 9
Human resources team members: 1
Finance: 2
Contractors: 2
Email subscribers: 8,526
Podcast downloads: 65,246
Site visits: 247,419
Revenue
Brokered site sales: $44,587,042.28
Listing fees: -$297.00
Additional/other revenue: $18.93
Total revenue: $44,586,764.21
Average deal size: $557,338.03
Earnings
Brokered site earnings: $2,508,507.87
Listing fees: -$297.00
Additional/other revenue: $18.93
Total gross earnings: $2,508,229.80
2020 Financial Numbers
Revenue
Brokered site sales: $82,447,933.94
Listing fees: $18,651.00
Additional/other revenue: $145.91
Average deal size: $262,626.52
Total revenue: $82,466,730.85
Earnings
Brokered site earnings: $6,968,327.28
Listing fees: $18,651.00
Additional/other revenue: $145.91
Total gross earnings: $6,987,124.19
Financially speaking, 2020 ended up being the best year ever at our M&A brokerage. The start of the year was a trying time, but as the year wore on, we hit our stride as the online business M&A space boomed in huge and unexpected ways.
Before we break down our revenue numbers further, let’s show you all the 7-8 figure deals that are ready to be bought right now on our marketplace. If you haven’t registered for a free Empire Flippers marketplace account yet, you can do that here.
7-8 Figure Businesses for Sale Right Now
- Listing #50232: A display advertising and affiliate website in the lifestyle niche. Created in July 2017, this business is being sold for $2,345,828.
- Listing #48575: An Amazon FBA business in the outdoors niche. Created in May 2015, this business is being sold for $1,672,283.
- Listing #48743: An Amazon FBA business in the home niche. Created in October 2015, this business is being sold for $1,293,989.
- Listing #49671: An Amazon FBA business in the home niche. Created in August 2016, this being is being sold for $1,139,203.
- Listing #49742: An Amazon FBA business in the outdoors niche. Created in December 2016, this business is being sold for $10,303,887.
- Listing #47466: An Amazon FBA business in the medical equipment niche. Created in October 2015, this business is being sold for $7,082,554.
- Listing #49364: An ecommerce business in the apparel niche. Created in January 2017, this business is being sold for $6,578,407.
- Listing #47853: An Amazon FBA business in the kitchen niche. Created in February 2016, this business is being sold for $5,018,008.
- Listing #49215: An ecommerce business in the children niche. Created in August 2015, this business is being sold for $5,016,218.
- Listing #48704: A 4-site affiliate website package in the legal niche. Created in July 2017, this business is being sold for $4,472,415.
- Listing #48259: An ecommerce business in the apparel niche. Created in June 2019, this business is being sold for $3,633,374.
- Listing #49202: An Amazon FBA business in the beauty niche. Created in May 2014, this business is being sold for $3,199,155.
- Listing #47101: An Amazon FBA business in the occasions and gifts niche. Created in December 2016, this business is being sold for $1,932,422.
- Listing #49133: An Amazon FBA business in the beauty niche. Created in October 2010, this business is being sold for $1,833,395.
- Listing #50184: An ecommerce and affiliate business in the apparel niche. Created in April 2018, this business is being sold for $1,705,126.
- Listing #47242: An affiliate site in the survival and security niche. Created in January 2017, this business is being sold for $1,669,854.
- Listing #48344: An ecommerce and Amazon FBA business in the kitchenware niche. Created in January 2015, this business is being sold for $1,438,692.
- Listing #49028: An Amazon FBA business operating in multiple niches. Created in March 2014, this business is being sold for $1,432,254.
- Listing #48865: A dropshipping store in the entertainment niche. Created in October 2017, this business is being sold for $1,365,766.
- Listing #49634: An affiliate website in the pets niche. Created in November 2017, this business is being sold for $1,138,146.
- Listing #49784: A SaaS and affiliate business in the finance niche. Created in 2019, this business is being sold for $1,118,824.
- Listing #47834: An ecommerce business in the entertainment niche. Created in April 2000, this business is being sold for $1,104,944.
These represent the most 7 figure+ listings we’ve had on the marketplace at one given time. The crazy thing is, we don’t think this is an outlier; rather, we think this will become a more normal trend as our marketplace continues to increase the amount of high-quality listings.
Revenue Breakdown
All the business data above paints an interesting picture. However, it doesn’t tell the full story of what happened in Q4, and to a larger extent, 2020 overall.
Let’s break down the business data in more detail.
Brokered Site Revenue
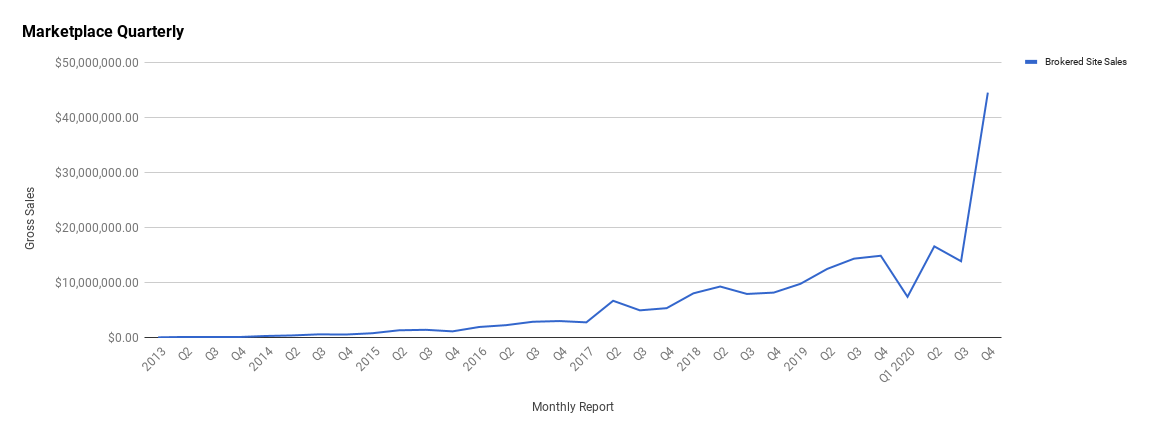
In Q4, 2020 was a record shattering quarter. Not only was it the best quarter of the year, but it also generated more revenue in Q4 than the entirety of Q1, Q2, and Q3 combined.
Our Q4 sales came to $44,587,042.28, which is a gigantic increase from Q3’s $13,878,584.86.
In 2020, we sold a total of $82,466,730.85 businesses, which is a sharp increase from 2019’s $51,501,836.25.
Keep in mind, though, we only kept a small percentage of this revenue as actual gross earnings. The gross earnings in 2020 came out to $6,987,124.19 versus 2019’s $6,125,915.49.
You’ll probably notice that, proportionally, our earnings increase wasn’t nearly as high as our sales increase from 2019 to 2020. This is primarily due to decreased margins or fees on the larger deals.
For example, the 8-figure deal we sold in 2020 increased our sales substantially, but we only took in 2% commission on that deal. We’ll cover this a bit later in the report.
It’s also worth noting that the larger deals typically include earnouts that need to be managed (and paid out) over time, so we’ll be getting paid in residuals on these over the coming months/quarters.
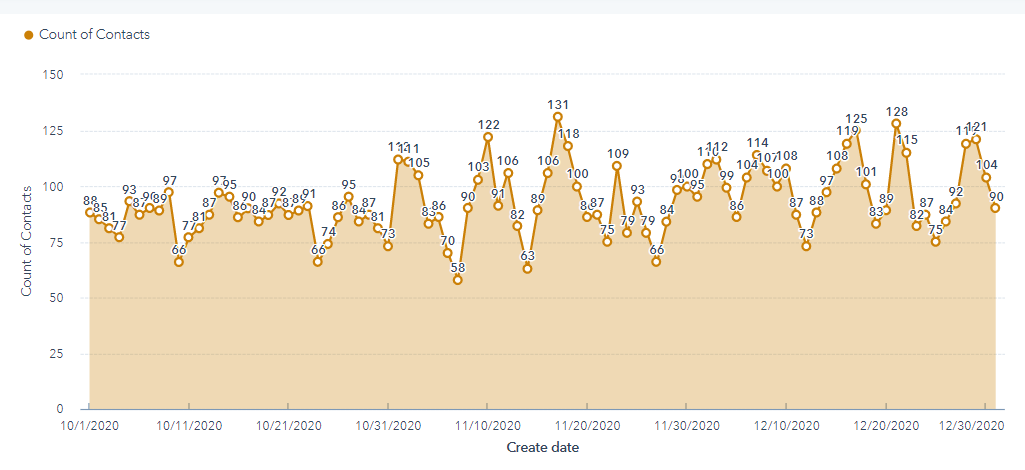
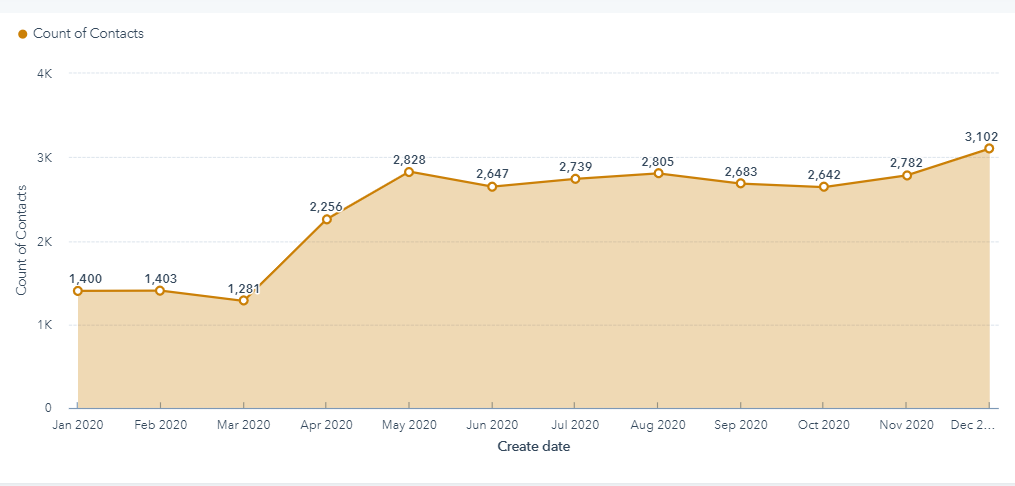
Here is a breakdown of our growth quarter by quarter:
Here is a picture of our sales over all time:
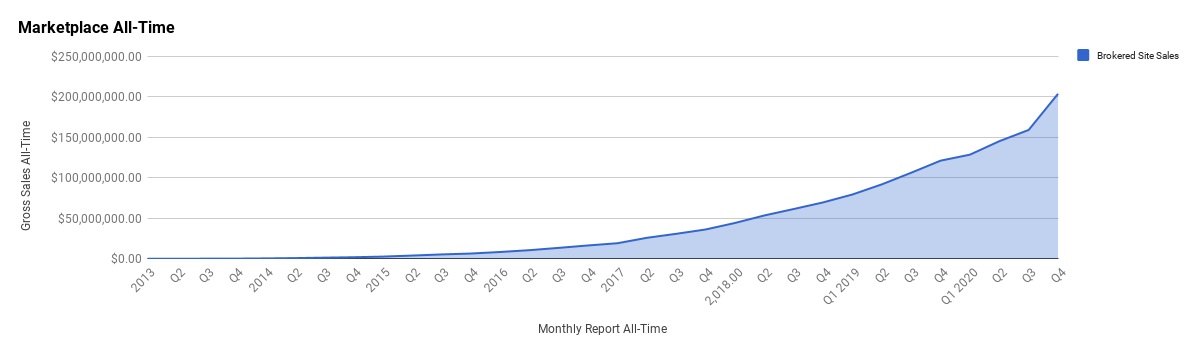
The last graph shows our growth at a steady but aggressive clip over the years. The first graph, though, shows more of what it’s like operating an M&A brokerage firm quarter to quarter: dips and spikes.
Why does this happen?
The simple answer is that we are selling larger businesses, and they tend to be a bit less consistent. As we continue to move up the value chain and sell larger deals, you’ll see a bit more consistency in the sales over time.
It’s also accounting for our first 8-figure sale which was completed in Q4 2020. Add that deal along with the increased number of deals overall in Q4 and you have your spike.
It took us 8 months to sell our first 7-figure deal, but we’ve now helped 34 entrepreneurs become millionaires through the sale of their business. (Not to mention the 22 additional 7-figure listings we currently have for sale).
Once a broker crosses that initial threshold and proves they can do what they say they will do, it opens up a massive floodgate that leads to more 7-figure deals.
In Q4, 2020, we crossed the 8-figure threshold. A seller trusted us with the business, and we were able to sell it (keep an eye out for a case study coming out on the 8-figure sale soon). The very nature of selling the 8-figure business has already led to an increase of submissions on 8-figure businesses.
We initially started getting interest from 8-figure sellers to pull the trigger and try out our marketplace by offering a 2% commission on the successful sale of the business. This is incredibly low as far as our industry goes. However, sometimes, to break into new markets, a business needs to create that irresistible offer to show the market what you can do. The 2% commission attracted several profitable conversions, an 8-figure sale, and put us on the radar for other 8-figure sellers.
If you are an 8-figure seller, keep in mind that our 2% commission fee on these businesses will likely be going away soon. You might still be able to take advantage of it if you decide to sell your business right now.
We’ll likely be increasing this 2% fee soon as it has accomplished its purpose: showing 8-figure sellers that we have 8-figure buyers.
At the time of this writing in Q1 2020, we’ve already closed another 8-figure business, and we have a third 8-figure business that looks like it might also sell soon.
By this time next year, it is not unfeasible to think that we’ll be breaking this quarterly report down not just by what 7-figure businesses we have live on the marketplace, but by the 8-figure businesses as well.
As you might imagine, selling an 8-figure business, plus the 7-figure businesses we sold in Q4, has made our average deal size shoot up in a big way!
Take a look at our average deal size broken down by quarter below:
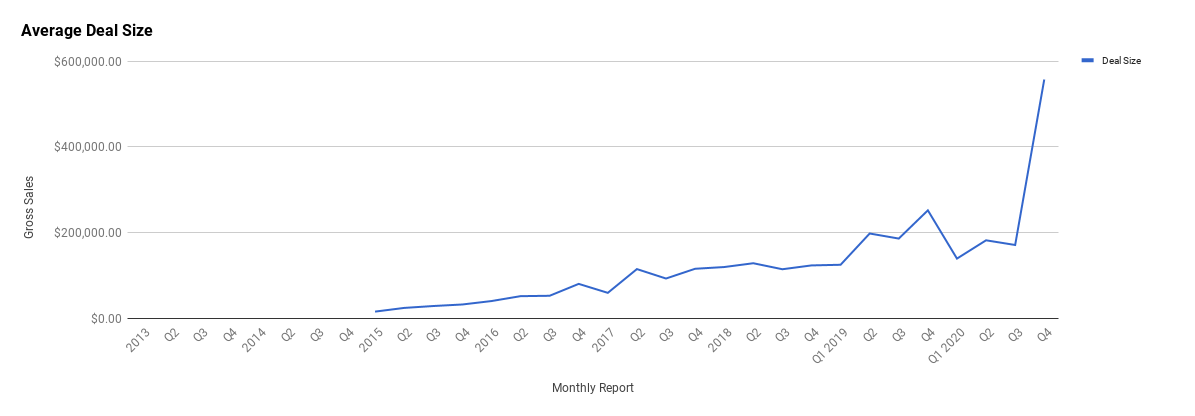
In Q4 2020, our average deal size was $557,338.03, a massive increase from Q3’s average deal size of $171,340.55. At first glance, we thought that our average deal size would most likely drop in Q1 2021. But now that there are two potential 8-figure businesses being sold on our marketplace, there is a solid chance that our average deal size might stay the same or possibly even go up in Q1.
For the year as a whole, our average deal size came out to $262,626.52, which is a significant increase from 2019’s annual average deal size of $190,433.88.
While we’d expect our average deal size to continue to increase, removing our listing fee in the latter half of 2020 has significantly increased submissions overall – especially at the lower end. Removing our listing fees has led to an increase from 20–30 new seller submissions per week to 120–150 new seller submissions per week, with many of these in the 5-6 figure range.
The industry began to heat up in a big way towards the end of 2020, and based on the success of our industry during a very turbulent year, we’re more convinced than ever that our business model is resilient.
Everything we’ve seen in 2020 makes us very optimistic as we head into 2021, not only for ourselves but for our customers and friends in the online business space.
We’re putting our money where our mouth is, so to speak, and significantly investing in growth as we head into 2021.
Business Listing Fees
This will likely be the last time we include business listing fees in a quarterly report. We’ve previously used listing fees as a filter – keeping out those who weren’t serious about selling. It worked great for a number of years.
Yet, as the technology on our platform grew, we realized we didn’t really need a listing fee to do this for us anymore. Instead, we have sellers verify their identity as the filtering mechanism, which works just as well and has promoted a large number of new seller submissions on the marketplace that wouldn’t have listed with us otherwise.
An interesting thing to note here is that you’d initially think the listing fee was only a negative for entrepreneurs with smaller businesses in the sub $100k range. However, this is not always the case. Many owners of large businesses have also found the new process change to be a motivating factor to use us over other brokers.
In Q4, we actually had -$297 in listing fees due to refunding a seller who dropped out of our vetting process who had begun the process back when we still had listing fees. Outside of this, Q4 was the first full quarter where we had zero listing fees charged to anyone looking to sell.
It was also close to the first full quarter when we reduced our exclusivity from six months down to just two months when deciding to sell. We found the majority of the businesses we sell were sold under this two month mark, and those that didn’t were usually very close to a real offer.
If you want to take advantage of the no listing fee experience and the reduced two-month exclusivity with our marketplace, you can sell your business here.

Traffic and Audience
Website Traffic and Analytics
Our website remains our most important asset for our business. Not only were we able to make great strides in our SEO efforts with our marketplace in 2020, but our blog continues to grow with its organic traffic as well.
We’ve always been heavily focused on being an inbound organization, which means our blog is a major part of our marketing strategy. Organic traffic from Google remains our main driver for traffic across the website, as well as our main way of acquiring new customers.
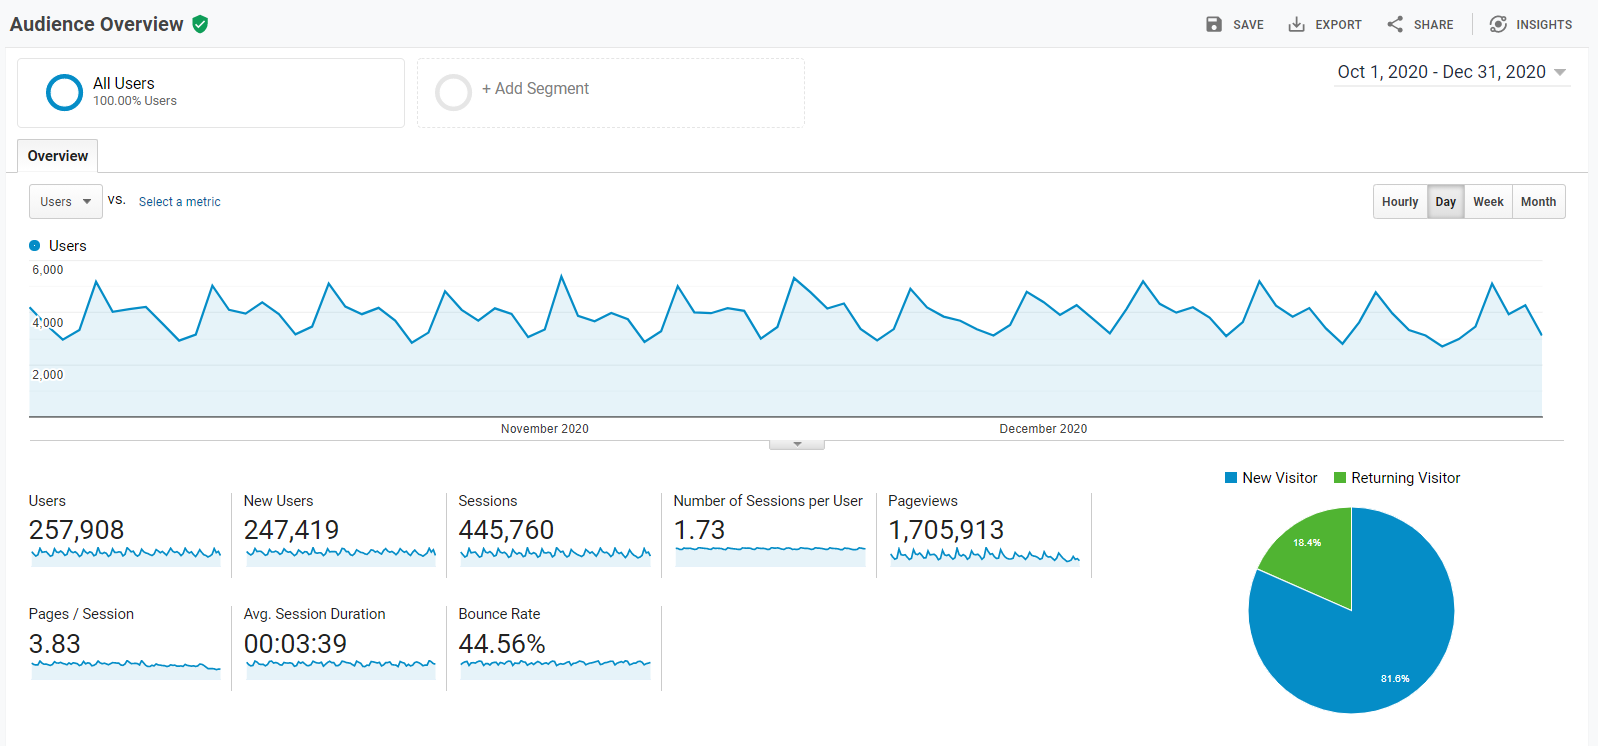
Here’s a look at our traffic for Q4:
Here’s our Q4 traffic compared to our Q3 traffic:
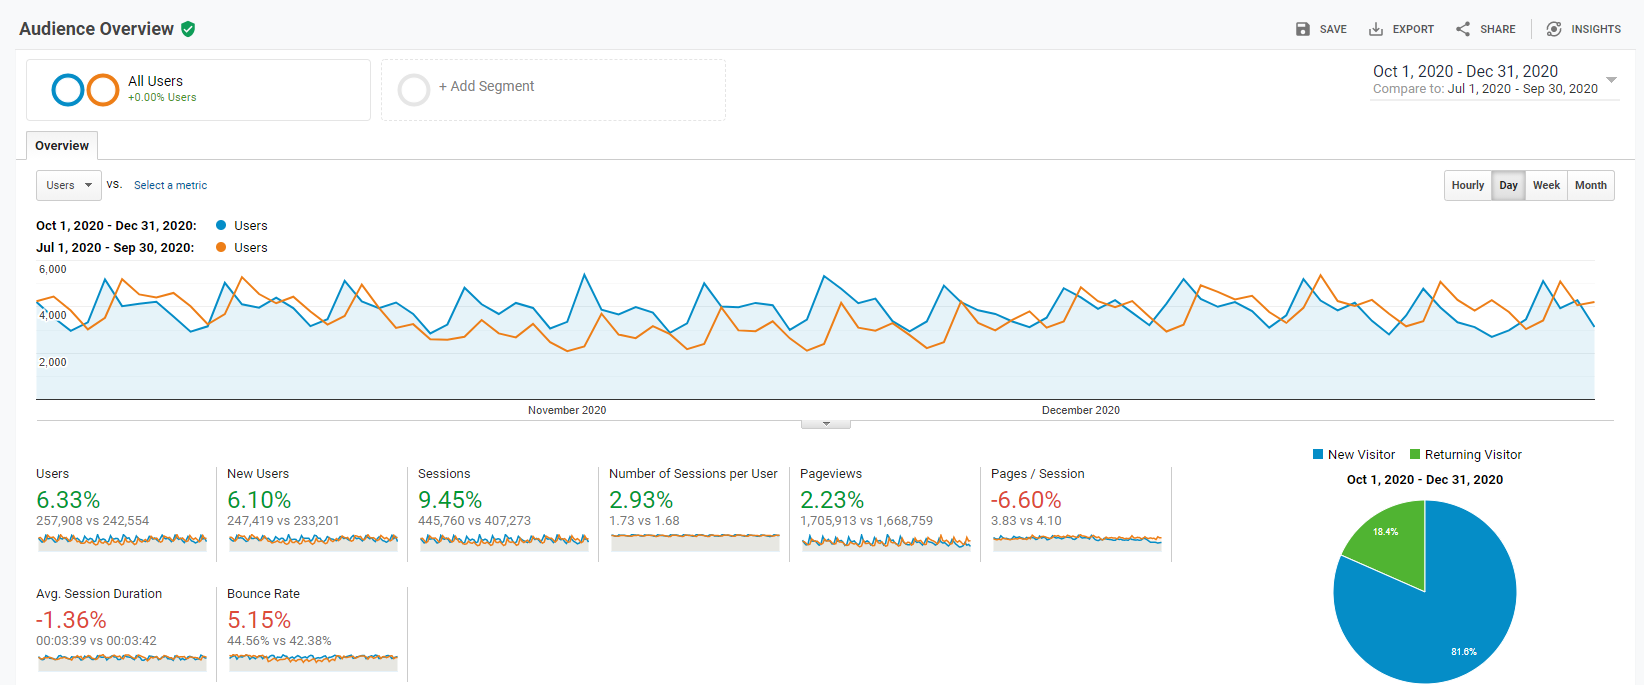
In Q4, we had 247,419 new users come to the website, which is up from Q3’s 233,201 and is an increase of 6.10%. Across the board, our numbers were up aside from pages per session, average sessions, and our bounce rate. Part of the metrics for these numbers is likely the traffic going to register for a marketplace account and reviewing businesses for sale within our new tech platform, which is hosted as an app rather than on the actual website.
A large portion of Q4 was spent optimizing old content across our blog using Clearscope. As of this writing, the results have been mixed, with some of our blog posts rising and others staying relatively the same in terms of organic positions.
We are still in the process of optimizing all of our old content, though, so we should know whether on page SEO had any benefit for us in another couple of months.
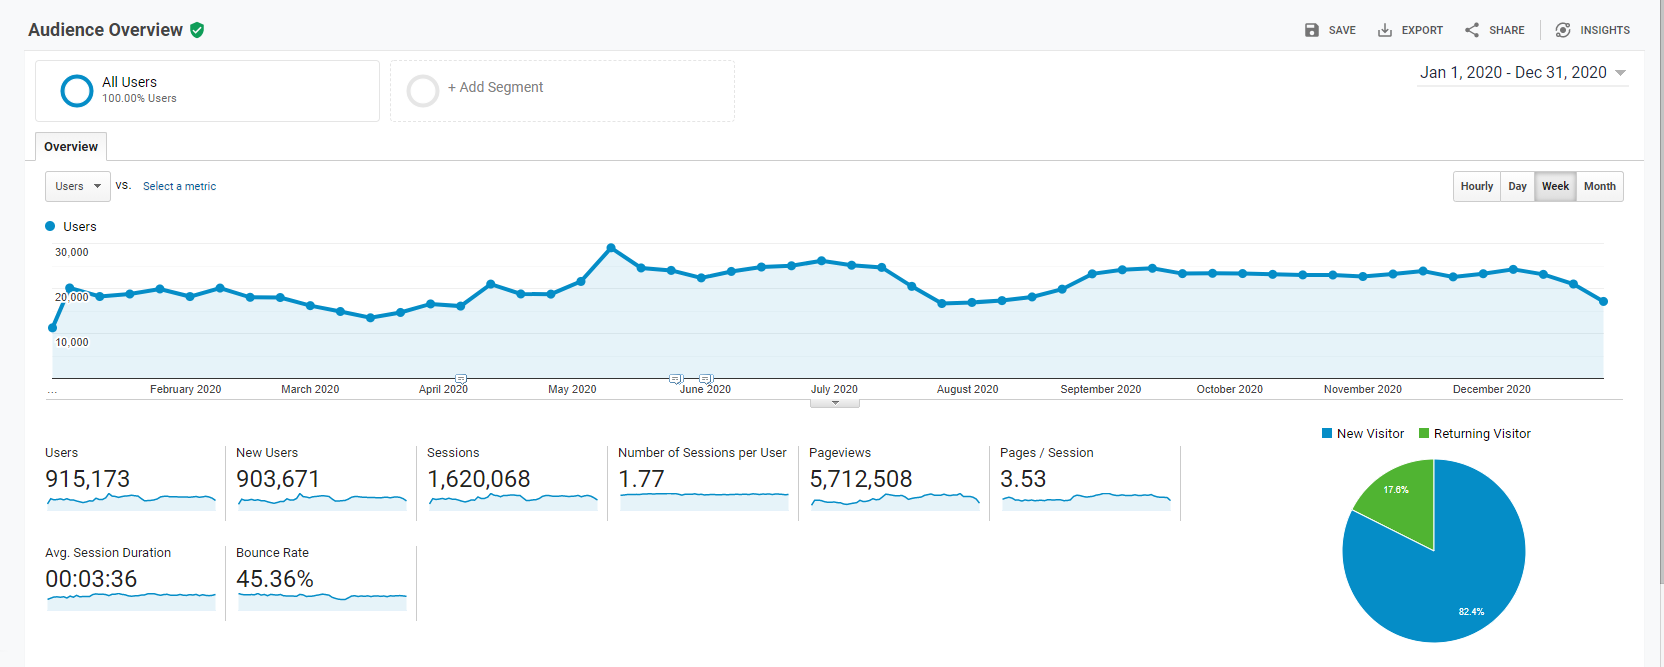
Here’s a look at our 2020 traffic overall:
Here’s our 2020 traffic compared to 2019:
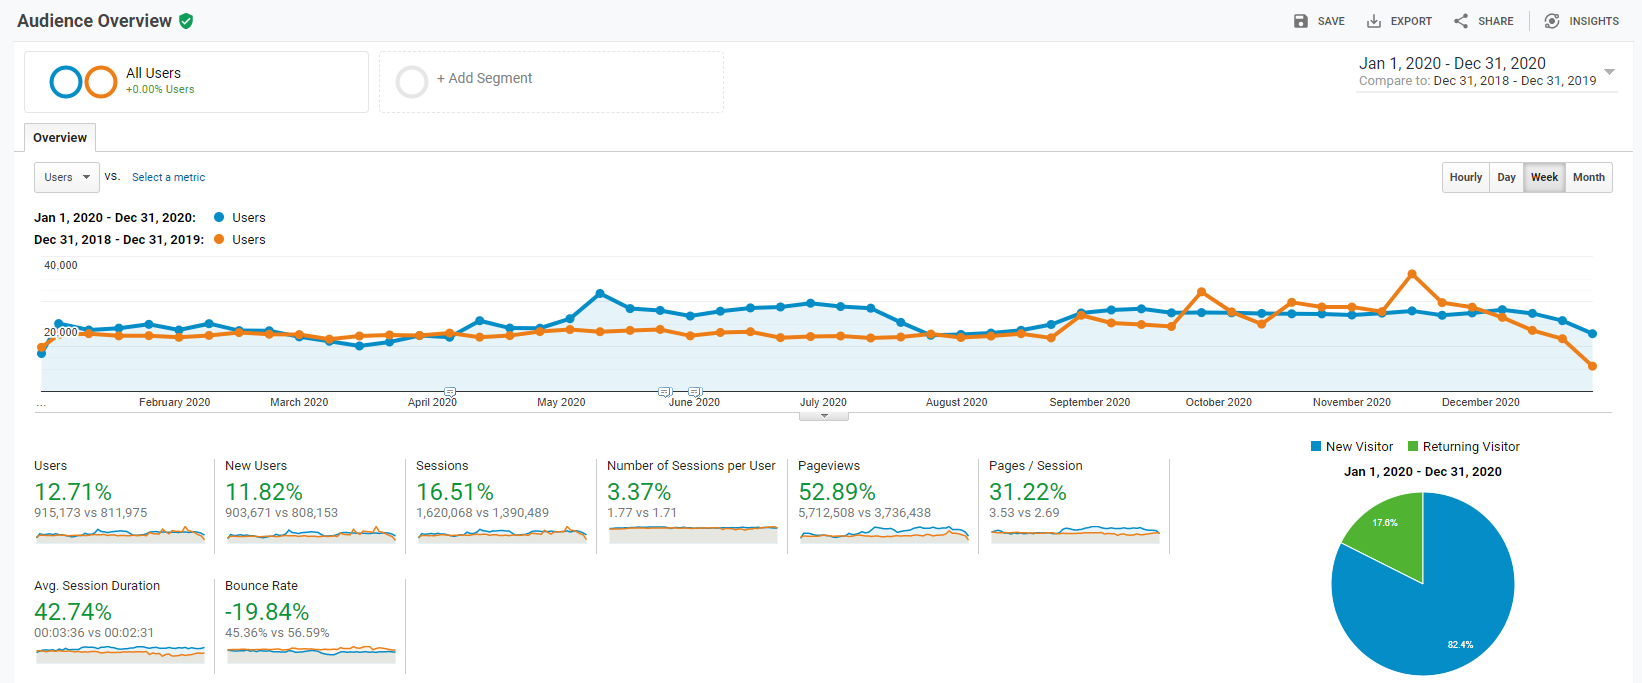
When you look at our traffic across 2020, you can see we generated 903,671 new users to the website. This is a nice yearly increase of 11.82% versus 2019. When you look at the comparison of the two years, you can see we had a dip during some of the summer months of 2020. This is likely due to an algorithmic update that hit us, but we recovered from that.
Overall, the trend of the traffic remains higher than 2019. Our goal going into 2021 will be to grow our SEO traffic by a further 20%, which is 8% more than what we did in 2020. We’ve spent quite a bit of time training our content specialists on how to identify quality SEO-driven articles to write for the blog, and we’re confident that, between our SEO efforts and the growing interest and demand in buying and selling online businesses, we can pull it off.
Here is our referral traffic for Q4:
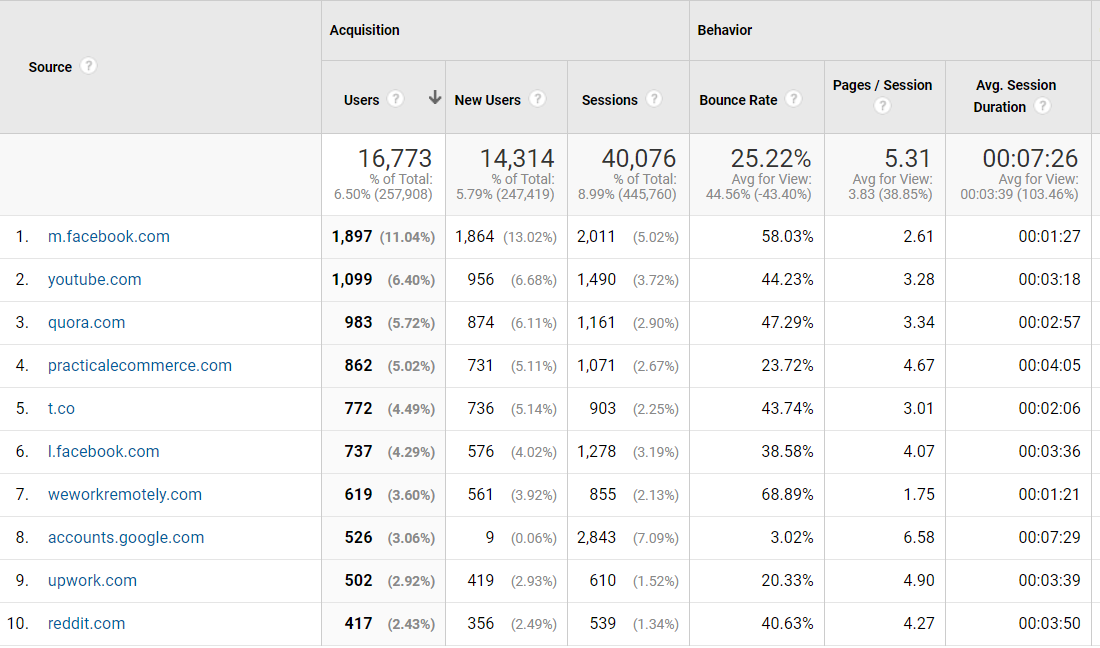
And our referral traffic for 2020:
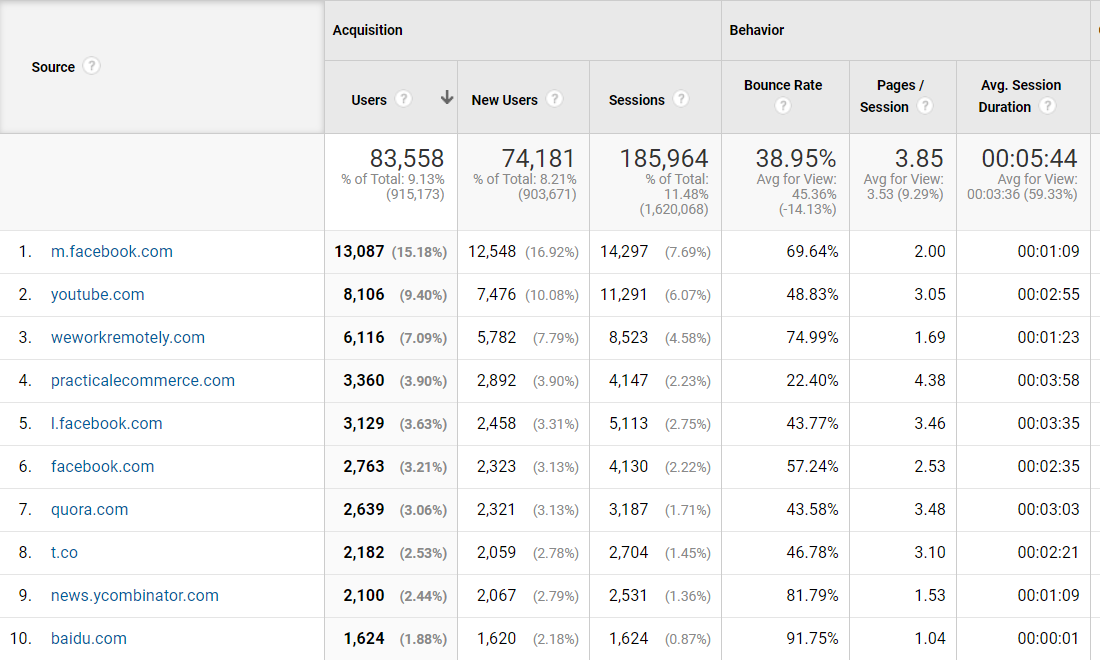
Referral traffic made up a sizable chunk of traffic for us, both in Q4 and in 2020 as a whole. Facebook remains our standout referral channel. This is likely because of all the private groups among entrepreneurs talking about exiting or buying businesses that popped up throughout 2020. Many of those conversations revolved around our marketplace, and it makes sense that they would drive referral traffic to us when entrepreneurs are considering to sell.
While a distant second, YouTube is next in sending us the most referral traffic both in Q4 and 2020. We expect this to grow significantly in 2021, as we put more focus on creating video content for our audience.
Quora is down at #7 for the year, but #3 in terms of referral traffic for Q4. In Q3, we had done a ton of work on Quora, building an entire process to answer questions related to our industry and tangentially related topics. We felt we had peaked in what we could produce in Quora and the results were not worth actively pursuing further.
We have been exploring other organic channels that could send us recurring traffic, and in Q4, we did zero work on Quora. We had 983 users come from Quora, which is 37% of the annual traffic we got from the website. The passive traffic coming in from the site will hopefully stay around this level during Q1, and if it does, it may be worth starting our Quora marketing plan again to scout for new questions to answer. The problem we ran into with Quora was simply running out of solid questions we could answer that were related to what we do.
Still, it’s nice to see this extra layer of organic traffic coming in, even if it is small.
Q4 of 2020 was our first real quarter for publishing heavier on our educational YouTube channel as well – something that we are committed to growing in 2021.
Here’s our Q4 educational YouTube analytics:
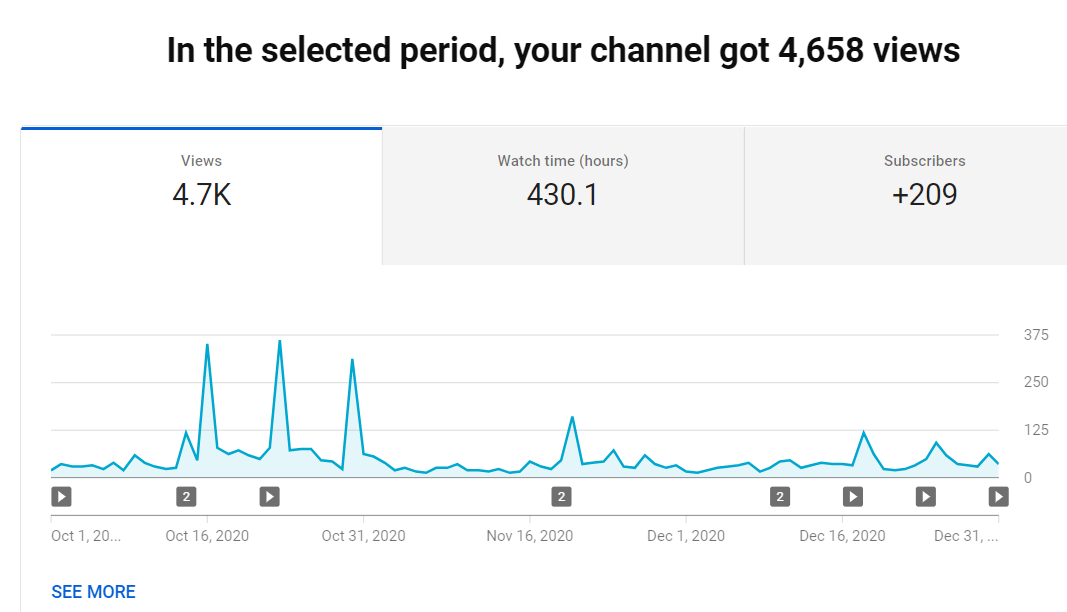
In Q4, we generated 4,658 views on our YouTube channel. While this is not a terrible number for a new channel, we were hoping for a lot more than this considering the size of our audience. There are likely a mixture of things that hampered us down here.
One of the biggest challenges is creating a consistent publishing schedule. As with most content marketing, the biggest key to success is often just consistently publishing and feeding your audience with valuable content.
Here’s our 2020 educational YouTube analytics overall:
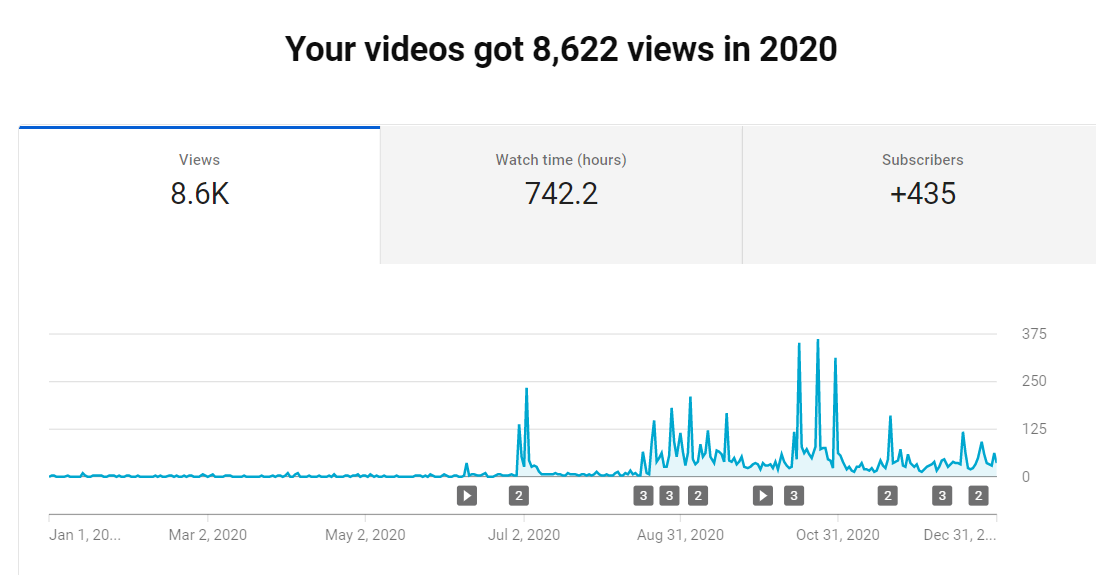
You can see we generated over half of our YouTube views in 2020 in Q4. This is almost without a doubt simply because we published videos more often.
One of the real traffic behemoths we are trying to tap into with our YouTube channel is the recommendation engine. The recommendation traffic has been small so far, but something we’re looking to improve on.
YouTube is one of the largest search engines in the world, so we view this as a gigantic opportunity for marketplace exposure.
Here are our top three most popular YouTube videos in Q4:
1. What is Google AdSense? Should You Still Use It?
Here are our top three most viewed pages for 2020:
Here are our top three most viewed listings in Q4:
- Listing ##48259: Ecommerce business in the apparel and accessory niche, hosted on a Shopify store featuring 87 SKUs. Created in June 2019, the business is being sold for $3,633,374.
- Listing ##48704: A 4 site affiliate package in the legal niche. Created in July 2017, the business is being sold for $4,472,415.
- Listing ##47853: An Amazon FBA business in the home and kitchen niche featuring 158 SKUs. Created in February 2016, the business is being sold for $5,018,008.
Here are our top three most viewed listings in 2020:
- Listing #46538: A SaaS in the business niche that provides a platform to connect certain individuals. Created in January 2009, the business is being sold for $747,403.
- Listing #47198 (SOLD!): An Amazon FBA business in the health and fitness niche featuring 3 SKUs. Created in October 2017, the business sold for $2,474,495.
- Listing #47459 (SOLD!): An Amazon FBA business in the personal care niche featuring 26 SKUs. Created in January 2016, the business sold for $11,883,060.
Here are our top three most viewed pieces of content in Q4:
- The Most Popular Online Business Models
- The Lead Gen Business Model Explained
- [CASE STUDY] How We Sold a $93,077.32 Merch by Amazon Business in 19 Days
Here are our top three most viewed pieces of content in 2020:
- How to Start an Amazon FBA Business
- The Most Popular Online Business Models
- The SaaS Business Model Explained
Here are our top three most viewed pieces of recent content in Q4:
- Set Up and Start Selling: How to Create Your First Amazon Seller Account
- How to Make $50K, $100K, or $500K Online
- What is the Return on Investment for Buying an Amazon FBA Business?
Here are our top three most viewed pieces of recent content in 2020:
- SaaS Pricing Models & How They Affect Valuation
- How SaaS Valuations Work: Multiples, Metrics and MRR
- How to Make $50K, $100K, or $500K Online
Podcasts and Shows
Empire Flippers Show
The Empire Flippers Show remains our flagship podcast. It features our co-founders Justin Cooke and Joe Magnotti, who co-host the show and deliver insights on the online business M&A industry. It features interviews with high-level entrepreneurs, investors, and more.
Here’s how the show did in Q4:
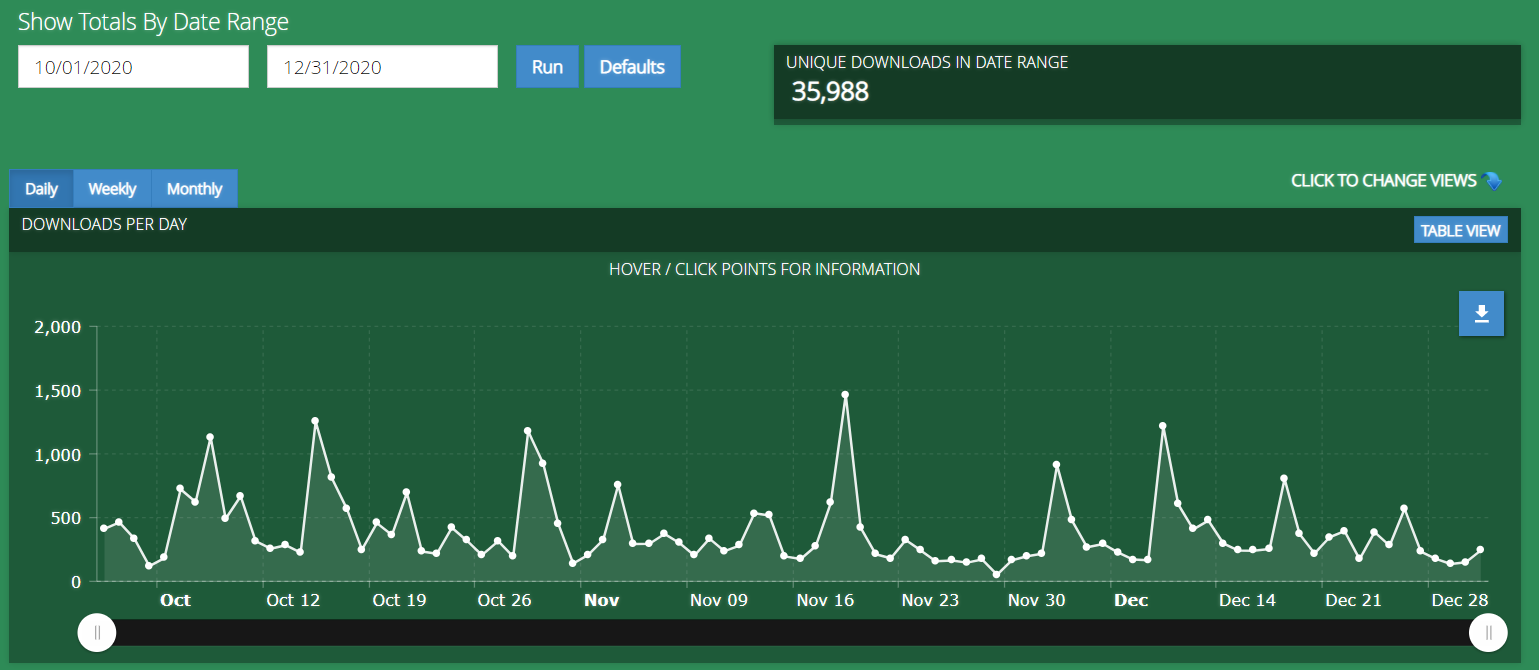
In Q4, we had 35,988 podcast downloads, which was down from Q3 2020, where we had 39,147 downloads. Even with the downward slump, we’re pleased with the overall download numbers here.
Here’s how we did throughout 2020:
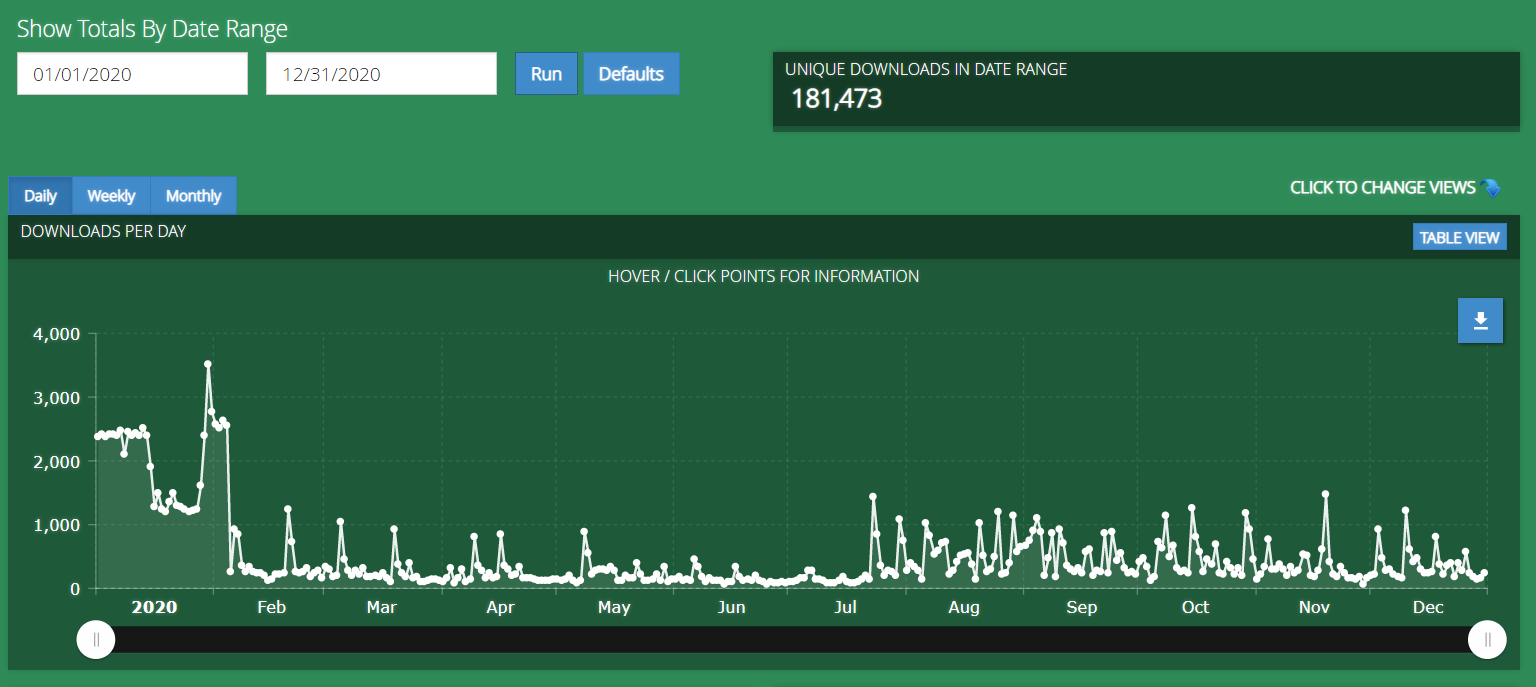
We had 181,473 downloads in 2020, and the first thing you’re probably noticing is that gigantic spike at the start of the year, with a huge slump afterwards. This is an anomaly. For some reason, in Q1 and towards the end of Q4 2019, we had a burst of spammy downloads (seemingly concentrated from France) downloading the podcast. We’re pretty sure these were bots, but we were never able to fully figure out what happened there.
It was in Q3 where you see our downloads uptick in a big way, and that is because we started producing episodes again in a more consistent manner. Consistent publishing always leads to higher levels of downloads for us.
Here are the most downloaded episodes for Q4 2020:
- EFP 208: The Contrepreneur Formula With Mike Winnet
- EFP 209: How To Buy For Value In 2020
- EFP 207: Massive Funds Buying Up The Market In 2020
Listen to the latest episodes on your favorite podcast player.


Also, if you want to help support the podcast, make sure to leave a review!
The Web Equity Show
The Web Equity Show is done in seasons, with each season focusing on a single aspect of the online M&A industry. It is one of the most complete A-to-Z guides on buying or selling online businesses if you start from Season 1 Episode 1. The show is hosted by our co-founder Justin Cooke and M&A expert Ace Chapman.
Here’s how we did in Q4 2020:
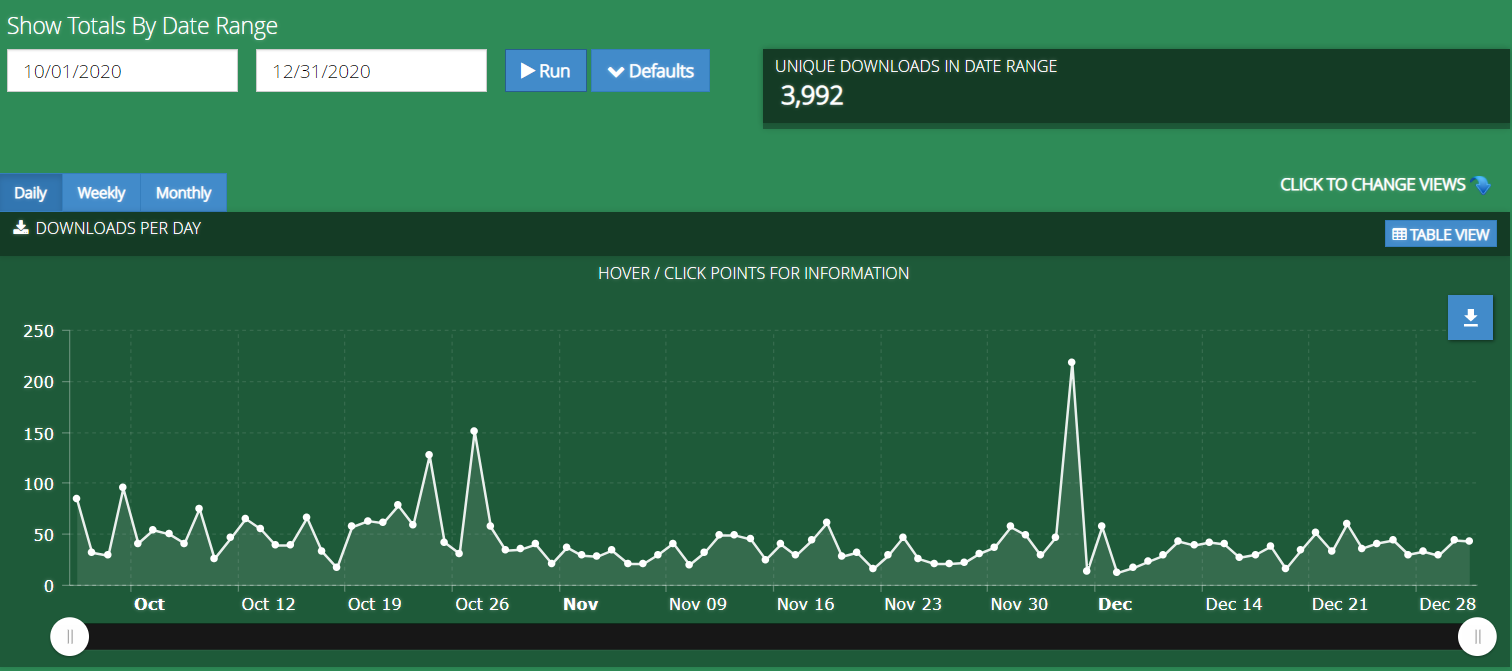
We had 3,992 downloads in Q4, which was down from Q3, where we had 4,454 downloads.
Here are our downloads for the show throughout 2020:
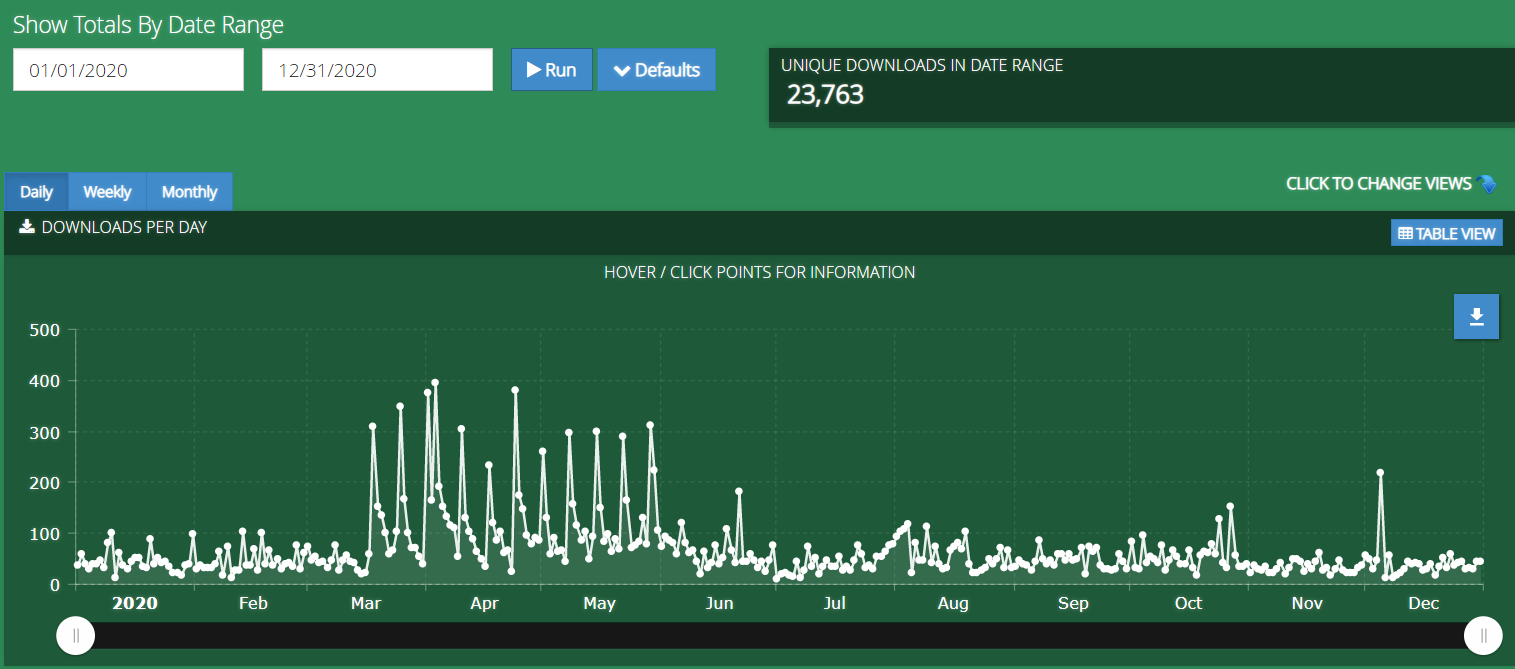
We had 23,653 downloads with the majority happening towards the end of Q1 and throughout Q2. This was a kickoff of the newest season where Justin and Ace did a season talking about current events in the industry and the effects of the global pandemic upon it.
While no new shows are currently planned for 2021, we’ll likely be publishing more sometime throughout the year to recap the fast evolution of our industry in 2020.
Here are our most downloaded episodes in Q4 2020:
Listen to the latest episodes on your favorite podcast player.
Also, if you want to help support the podcast make sure to leave a review!
Real Money Real Business (RMRB)
RMRB is an almost daily podcast at this point, thanks to how many sellers we have going live on our marketplace. Every time we have a seller with a business over $50,000 in valuation, we reach out to the sellers to do an interview for both our podcast and main YouTube channel.
It is one of the few shows out there where you can hear from entrepreneurs who normally do not have a platform to speak to other entrepreneurs. You get to hear what their business is, how they built it, the challenges they’ve overcome, and, ultimately, the value of the business they’ve built.
While we do this show to help promote the businesses we have for sale, we’ve discovered that many people in the industry find the stories inspiring; they feel motivated to build their own businesses to higher levels.
Here’s how our downloads went in Q4 2020:

We had 18,102 downloads, which is up from Q3, where we had 15,972. Part of this boost in downloads is likely coming from the massive number of sellers we got listed on our marketplace in Q4. The show has now been publishing multiple times per week for the better part of eight months, which means it is starting to also get recommended by others for people to check out.
In fact, RMRB was listed as one of the best Amazon FBA podcasts by an independent blog earlier in 2020. This is likely because we have become the #1 marketplace in terms of the sheer quantity of Amazon FBA business we have for sale; thus, many of the episodes feature entrepreneurs in this business model.
Here’s how we did in 2020 for downloads:
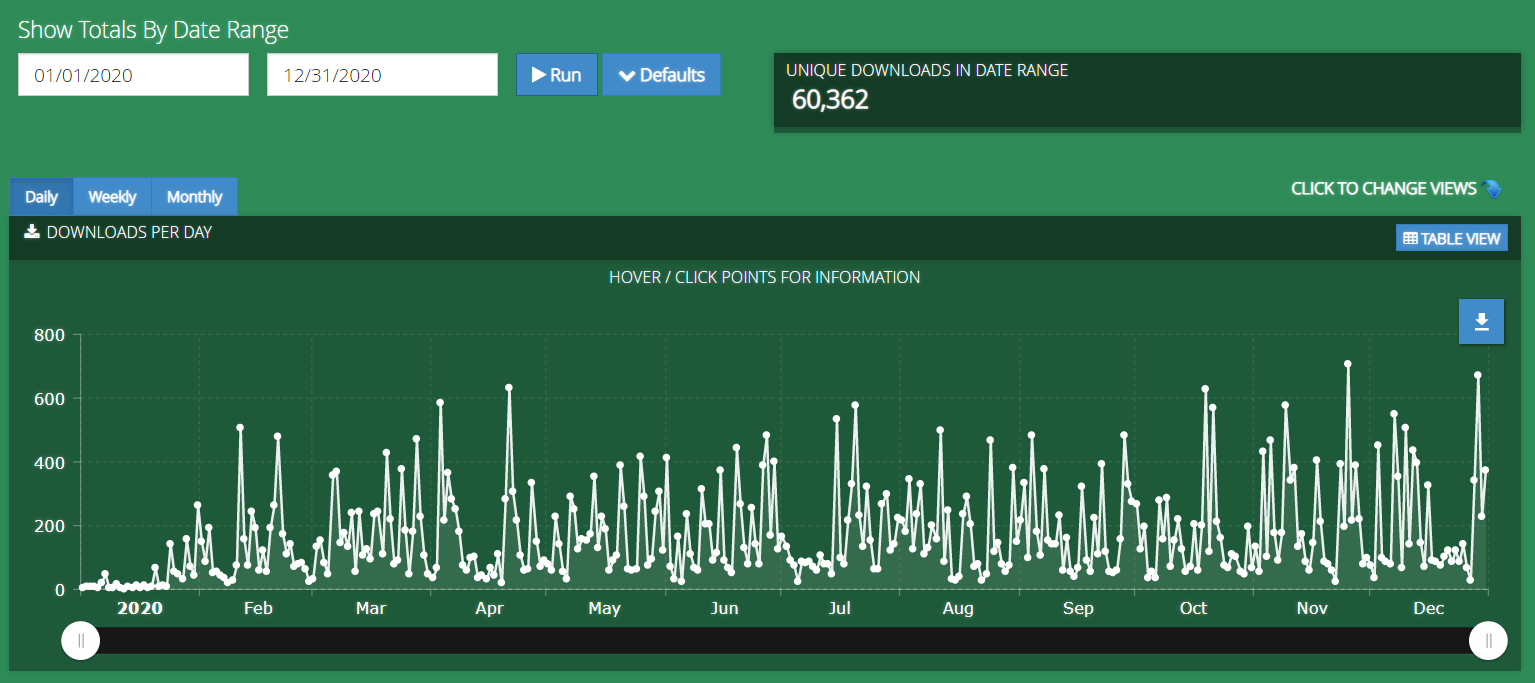
In 2020, we had 60,362 downloads for RMRB. You can see where we switched the podcast model from only posting what we considered the best seller interviews we were doing to publishing all of the interviews we do.
This increase in publishing is one of the biggest reasons for our increase in downloads and our ability to build a bigger and bigger audience listening to the show.
Here are our most downloaded episodes in Q4 for RMRB:
- RMRB 190: Earning $4k Each Month From Organic Traffic Only
- RMRB 195: Making $36,000 Each Month without Touching Any Inventory
- RMRB 194: Improving On-Page SEO Generates $16,700 in Profit Each Month For This Affiliate Business
Listen to the latest episodes on your favorite podcast player.
Also, if you want to help support the podcast make sure to leave a review!
The Opportunity Podcast
The Opportunity Podcast is still a relatively new show in our umbrella of podcasts. It was created because, when we looked at what kind of content existed in the online M&A space, we noticed there were very few places dedicated to telling the stories of actual buyers.
We decided to solve that problem with the Opportunity Podcast.
Every week, our co-hosts Sarah Nuttycombe and Branden Schmidt interview buyers, investors, and entrepreneurs about their acquisitions. They talk about how the entrepreneur got their start, their investment criteria, and walk through the various deals they’ve done—both their actual negotiations to acquire as well as what they did to grow their businesses.
Here are our downloads for Q4 2020:

We had 7,165 downloads in Q4, as Q4 was the first quarter we launched the show. The launch initially went well, and then we saw the downloads start declining. This is a fairly normal thing post-launch.
However, towards the end of Q4, we came up with the idea to send out a Sunday email to our list of buyers. The idea was to get our audience excited by the Monday listings that would be coming out by sharing an entertaining story from a real investor on Sunday.
This was effective, as a large number of our downloads occurring in the final month of Q4.
Moreover, it had an extra effect in that when we published a new episode, we got to notify all those who had subscribed to the podcast and got to market the episode a few days later with the Sunday email. This helped more people find the show, not just those from our audience, but other people browsing the various podcast platforms we’re on, as those platforms started suggesting the show to others thanks to the organic interest we were able to generate.
Here are our most downloaded episodes in Q4:
- The Opportunity Ep.12: How to Turn Your Windfall into Lifelong Cashflow and Strategic Investments
- The Opportunity Ep.14: How to Execute and Grow 4 Online Acquisitions in One Year
- The Opportunity Ep.13: From Footballer to Portfolio Owner – How to Reinvent Your Career Through Digital Assets
Listen to the latest episodes on your favorite podcast player.
Also, if you want to help support the podcast make sure to leave a review!
Email and Contacts
Email remains critical to our success at Empire Flippers. We use it to announce our new marketplace listings every week and nurture leads to the point where they are ready to register for a marketplace account to buy or exit their business for a large exit.
Here is how we did in growing our subscriber list in Q4 2020:
We generated 8,526 new subscribers in Q4, which is slightly up from the Q3 numbers at 8,227 new subscribers. For the most part, our subscriber generation is pretty steady, with a positive upward trend. A big reason for the lack of jump here is that we drive the majority of our subscribers from our SEO efforts. Barring any negative algorithm update by Google, we tend to perform steadily over the years when it comes to winning organic traffic.
However, that doesn’t mean we can’t see huge upticks in our subscribers. We definitely did in 2020 overall.
Here’s how we did in growing our subscriber list throughout 2020:
In 2020, we generated 28,568 subscribers to our email list. That number represents double the previous year, as in 2019 we generated 14,087 subscribers.
You can see a sharp rise in April, which is directly related to several SEO changes we implemented across the website. One of the biggest factors for this growth was us turning our marketplace into multiple pages dedicated to a single business model.
These changes allowed us to start ranking all kinds of great keywords for our business. Keywords like affiliate websites for sale, Amazon FBA businesses for sale, and even subsets of the main business models, like affiliate marketing with Amazon Associate websites for sale.
As you might imagine, this has allowed us to rank for a ton of commercial intent keywords for our business. Yet, an increase in SEO traffic to the marketplace was not the only part of the equation that led to an increase in our subscribers.
We also worked hard to turn our public marketplace, more or less, into a gigantic capture page. When you sign up for a free Empire Flippers marketplace account, you’ll get access to a ton of advanced search and filtering tools to help you with your acquisitions. We featured many of these tools on the public marketplace that included a variety of call-to-actions for people to register when they clicked to use these features.
So far, it has worked quite well as evidenced by the huge uptick to our email list in 2020.
However, not everything went completely smooth in our email marketing.
One of the major issues, as you grow and develop a variety of marketing funnels, is the problem of contacts overlapping into multiple funnels. This can sometimes lead to our contacts getting far too many emails which of course, leads to an uptick in unsubscribes. A goal of ours in 2021 is to review and likely decrease the frequency of emails our contacts receive while increasing the actual value of each of these emails.
An instance of our email work is our valuation tool, where we use real sales data to provide a ballpark valuation for online businesses within minutes. When someone fills out that tool, they’ll be entering one of several potentially nurtured marketing funnels based on the business model they’re in.
If they own an affiliate website, an ecommerce business, or a SaaS, when they enter their numbers into that tool, they’ll get a completely different funnel. Each of these business models will have its own methods of preparing for a profitable exit, and the new email funnels take that into account. The goal is to always provide our contacts with the most useful information that is relevant to their situation.
Yet, this can lead to some weird instances where they sign up for our valuation tool, then do a few other actions across the website, and now they might be in two or even three different marketing funnels. A lot of this problem is a legacy issue with the old email funnels we had, and it has gotten significantly better than it used to be.
Still, there’s some work left to do here.
We’re excited, though, as email is an absolute powerhouse for us when it comes to driving more sales on the marketplace, and we think there is going to be even more potential for us to tap into in 2021.
Customer Experience
Improving customer experience remains a top priority for us. Over the years, we’ve continued to improve both the process and the experience for end-users. This is something repeat sellers and buyers who have utilized our marketplace throughout the years have told us several times.
But, that doesn’t mean we’re not seeking to make it even better.
Our goal at Empire Flippers is to take a relatively murky, complicated, and frankly often emotional experience of buying or selling a business and make it easy. We want to take the friction out of the whole process, and we’re striving for that win-win-win scenario.
The seller wins with a life-changing exit, the buyer wins by acquiring a profitable asset, and we win because we helped the other two win.
Here are some of the compliments and criticisms we received in Q4 2020:

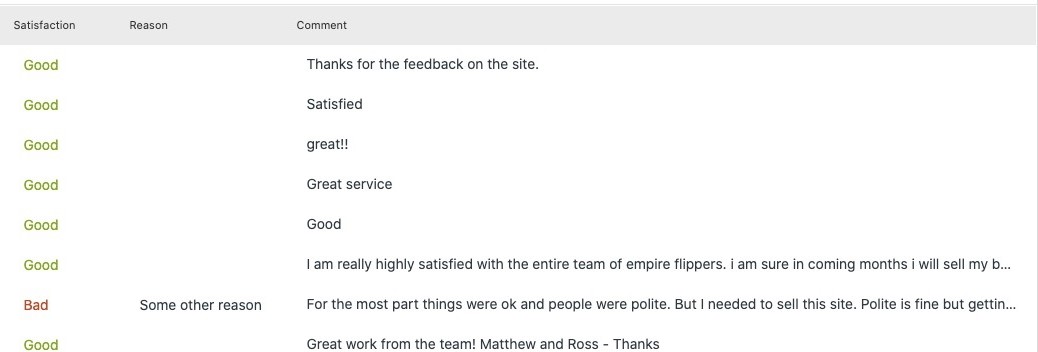
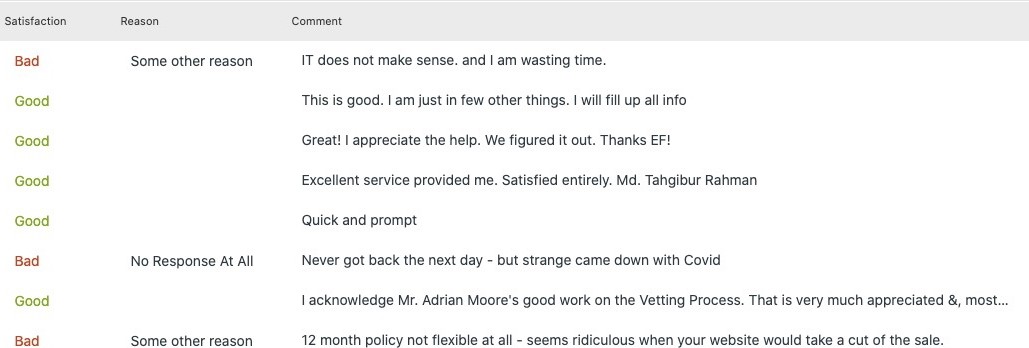
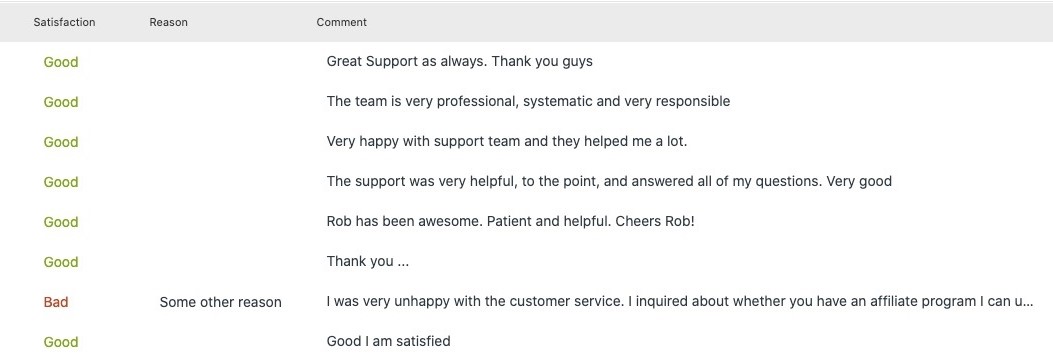
Most of our positive customer feedback is based on how quick we were to respond to buyers and sellers, our systematic way of selling businesses, and the professional nature of using our marketplace for both exits and acquisitions.
Not all of them thought we got back to them quickly enough, though. In one case, a customer was frustrated with one of our team members not showing up to a meeting due to our employee getting infected with COVID-19. (Insinuating it didn’t actually happen. I can assure you – it did!) Another customer gave us negative feedback due to simply rejecting their business for sale, which does create quite a few tickets filled with negative feedback for our team. It would make sense for this to be the case, as we reject around 88% of businesses that are submitted to sell on our marketplace.
One thing we want to do more is showcase our buyers and sellers in a bigger way. We want more stories of people in our space being told. This is one reason why we created the Opportunity Podcast, and one of the benefits of having the RMRB podcast too.
Still, we will be creating more customer testimonials to showcase even more emotional and amazing stories that have come out of our marketplace. If you haven’t seen our new testimonial page, then check it out here.
To give you a taste of what we’re hoping to produce in 2021, here is our top most viewed testimonial we’ve created:
What Happened in Q4 of 2020?
One of the things that DIDN’T happen would be conferences. Typically, the end of the year is where the majority of industry conferences are happening around the world, and this is one of the busiest times for our team. It can be tricky handling conferences while also handling our routine scope of work in serving our customers.
Alas, the COVID-19 pandemic continued throughout 2020, shuttering almost every conference we would normally attend throughout the year. Despite the lack of conferences, though, we still remained incredibly busy.
Demand for buying profitable digital assets has done nothing if not increased. There is a ravenous, growing appetite for these kinds of investments, and sellers are catching on that we are likely entering what we consider to be a seller’s market.
Selling Our First 8-Figure Business
In Q4 2020, we sold our first 8-figure business, an Amazon FBA business that sold for $11,800,000. The Amazon FBA business sold at 42x its average monthly net profit. The business was selling 35 SKUs and sold within 136 days of being on our marketplace.
This was a huge milestone for our brokerage. When you’re running a brokerage, you always have a bit of a chicken and egg problem. Sellers of a certain price threshold or business type don’t want to sell with you unless you can show them that you’ve sold another person’s business that is similar to theirs. But of course, how do you get the first one in order to show other people you can do it?
Once you find a seller willing to be the first, and once you successfully sell their business, that is when the floodgates really open up from a brokerage perspective. It’s similar to finding a product market fit with your startup. You’ve proven the model works.
Years ago, when we sold our first 7-figure business, it was a very similar scenario. It took us close to eight months to sell that first 7-figure business and we wrote about that in a case study here. The moment after we sold, we opened the floodgates for a rush of more. As of this writing, we’ve made 34 sellers millionaires just through the power of selling their business on our marketplace.
In order to get this first 8-figure business on the marketplace, we offered to sell the business for a 2% commission. This is by far the lowest in the industry, and it worked to attract the first few entrepreneurs willing to test out our marketplace.
Since selling this business, we’ve already listed another 8-figure business that looks like it will sell in a shorter time frame than our first one. We’ll be writing a case study on both of these businesses, so make sure to look for it on our blog.
If you have an 8-figure business you want to sell at our 2% commission rate, I would recommend selling it right now. As we get more of these businesses on the marketplace, we will most likely increase the percentage as we’ll no longer need such a low rate to get first movers on the marketplace.
If you have an 8-figure business and are ready to sell, you can do so here.
Most Seller Submissions of All Time
Towards the end of Q3, we removed our listing fees associated with someone wanting to sell their business with us. We used to use these listing fees as a buffer to weed out disqualified sellers.
We no longer need to do this since updating our platform. Now, instead of paying a listing fee to sell your business with us, you just need to submit your details and verify your identity by following the simple steps we have during the submission process.
This change has dramatically increased how many seller submissions we get every single week. Though this change happened late in the year, it made us eclipse 2019’s annual submissions by more than double.
In 2019, we had 1,491 seller submissions, and in 2020, we had 3,227 submissions. Our vetting team became overwhelmed when we first introduced this, which led to us hiring more members on the vetting team. As of this writing, we’ve also done our highest number of listings going live on the marketplace in a single week at 17 businesses for sale.
Our hope is that we’re able to beat both the 2020 seller submissions and the number of businesses that go live in a single week sometime throughout 2021.
Expanded Vetting
Dovetailing right into what we said above, our dramatic increase in seller submissions meant we needed to add more hands to our vetting team. We hired four new vetting professionals and trained them throughout Q4. This helped distribute the workload and led to us being able to handle a larger capacity of seller submissions.
We’re also looking at reorganizing the team to handle businesses based on pricing tiers. We’ve found businesses of a certain range are quicker and easier to vet, whereas larger businesses are often a far more intimate and time-consuming process. We’re still experimenting what this might look like, but we think dividing the vetting team into two sub-teams could be helpful to improve our efficiency.
Expanded Sales Team
In addition to expanding our vetting team, we also expanded our sales team. Our business analysts are industry-leading professionals that help negotiate deals on behalf of both buyers and sellers. We consider our sales team consultants who are on your side and ready to help you wade through what is a good or bad deal, when the terms are right, and how to make sure you make the best possible decision when it comes to exiting or acquiring.
We expanded both our buy and seller sides of the team by two.
It is particularly exciting to see the seller side grow. These business analysts are experts in creating effective exit plans to make sure sellers get the highest possible valuations when they go live on the marketplace, but they also serve as a guide for the entrepreneur through the often murky process of actually selling their business.
We spent most of Q4 training our new hires, and we’re excited to see what the future holds for both our vetting and sales team.
Introducing Live Chat Across the Website
After we experimented with chatbot funnels that didn’t produce the results we were hoping for, we decided to roll out live chat across the entire website.
Now, when you’re browsing our marketplace or looking to sell your business but still have some questions, you can simply click the little blue circle in the bottom right of the screen to open up a chat conversation, as you can see here:

You’ll be able to speak, in real time, with another Empire Flippers employee who can guide you through the process of setting up an account to buy a business or through the process of selling your business.
Depending on the questions you have, you will also be able to schedule a time to speak with our business analysts for deeper conversations. We’ve wanted to do this for a while, and now we finally have a team in place that is able to be on the website at almost all hours of the day.
Got a question? Give us a shout in the live chat!
Multiples Going Up – “Season of the Seller”
The demand for acquiring digital assets kept roaring ever louder as 2020 came to a close.
So far, in the beginning of 2021, we have seen that demand continue to grow. All of this increased demand meant that valuations across the board have been going up in a big way. It’s not only demand driving this, though, but also the fact that the vast majority of consumers are now forced to shop online due to the pandemic. This has led to many of our customers having the best months they’ve ever experienced in their businesses.
These higher revenue months, coupled with the greater demand, are two of the main drivers for increasing multiples. After years of being a leader in the online M&A space, we’re seeing an even stronger “Seller’s market” emerge.
We always tell people not to time the market. People ask us all the time when it’s best to sell their business, and our response is that the right time is when selling your business helps you achieve whatever goals you’ve outlined for yourself. You shouldn’t hold out for hopes of the valuations going up; rather, you should time your sale based on your own personal plan.
All that being said, if you did want to sell your business at a good time… it is hard to beat right now.
Right now, you could sell your business at some of the highest multiples we’ve seen for these assets, multiples that buyers have shown that they’ll buy at.
If you’re ready to sell your business during this season of the seller, click here to get started.
The Billion Dollar Marketplace – $1,624,868,673.33 Deployable Capital
Our market made waves in Q4 as news came out that $1 billion have been set aside to acquire Amazon FBA businesses. There are already dozens of institutional buyers, or brand aggregators, who are hunting for deals to acquire.
However, we think this $1 billion is actually low.
Why?
There’s MUCH more money out there that isn’t being reported on.
In order to buy a business from our marketplace, you have to register for a free account and you have to show us proof of funds that you actually have the liquidity to buy a business. This is the only way for you to unlock a business and conduct the deeper due diligence that is required if you’re going to buy.
Since implementing our proof-of-funds method on our marketplace platform, we have now tracked $1,624,868,673.33 in deployable capital from our buyer network.
That is just on our marketplace.
A large portion of that money is dedicated to Amazon FBA business. Even more exciting is that this number does not actually reflect the total net worth of our buyer network. Instead, it shows only a small slice of the capital that just our marketplace has, as our buyers aren’t showing us their entire liquidity.
They’re only showing us enough to look deeper at the businesses they’re interested in.
So, while the news is amazing for sellers looking to sell, we’re here to tell you that we’re pretty sure the news will be even more amazing than that in 2021.
Digital Investor Magazine
SEO has been our bread and butter for years. While we are still heavily pursuing organic traffic to the marketplace, we also wanted to experiment with other organic channels in 2020. These are channels that many content marketers have praised in case studies, such as Quora, Slideshare, LinkedIn, and Medium.
We decided to test out a few of these organic channels to see what would happen.
In Q4, we launched our Digital Investor Magazine on Medium. The magazine features articles filled with wisdom in a shorter, more story-driven format about buying and selling online businesses. We launched the publication a little over halfway through Q4, with more than 40 articles created by our content team.
While we’re still pretty new to Medium and unsure where it might lead, the initial results have actually been quite good for us. Outside of YouTube, Medium has probably driven the most initial positive results for us with these organic channel experiments.
We’re going to continue to grow the magazine in Q1 2021. We’re aiming to make it the “go-to” magazine publication on Medium for the online M&A space and will soon be opening up the magazine for voices outside Empire Flippers to also write for it.
If you’re interested in writing for the magazine with your own story in our industry, make sure to subscribe to our email newsletter. We’ll be announcing when we’re accepting submissions from outside of Empire Flippers, and this will most likely occur during our content wrap-up newsletter that we send out every Friday.
EF Capital
Perhaps one of the largest new projects we worked on in Q4 was EF Capital, led by long-time team member Mike Vranjkovic. Mike uses his experience in the financial world and combines that knowledge into a powerful new concept that we’re calling EF Capital.
EF Capital is striving to turn the active investing of digital assets into a way for mainstream investors to get passive high yields on their money. This, as you may imagine, is an incredibly difficult thing to pull off.
You need to have the investors looking to invest capital, but you also need to have talented operators who are steeped in skill in their chosen business model. These two parties rarely, if ever, interact with each other and often speak in totally different terms.
EF Capital solves this by putting them both in the same room and helping both sides get what they want. The operators get to scale their businesses without the often slow process of bootstrapping themselves to the next level, and investors get to collect high-yield returns on their money paid out as dividends.
The basic concept is that each operator will create a fund deal on EF Capital. Investors can read through the deal summaries of each operator, fund the operator with their capital, and the operator will go buy a business off our marketplace. The operator will then put their plan into action to scale and grow that business, with every investor getting a dividend paid out to them once per quarter, based on the earnings of that asset. Each investor will own a fractional share of equity in the acquired business, and they’ll also be able to see all the upside that can come with scaling a business, as well as the lucrative exit they can command.
If you want to read more about EF Capital and how it works, click here.
And That’s a Wrap!
While 2020 has been a really strange year, Q4 ended with one of our most productive quarters to date and our best year overall.
We’re optimistic in looking forward to 2021, and believe we’re on the right track to start growing in big ways.
Hopefully this report inspired you and what you can accomplish with your business. We started these reports back when we were selling tiny $100 websites, and now after years of hard work we’ve helped sell digital assets in the millions. Amazing things can happen when you roll up your sleeves and put in the hard work to make it happen.
Here’s to 2021 and may it become your best year in business.

