Q3 2020 Quarterly Report – July, August, September
 Updated on June 17, 2021

It’s that time of the quarter again!
Every quarter we try to take a few minutes to reflect on what went well, what we could have improved, etc. We’ve taken inspiration from other bloggers and content creators who have taken the time to lay out their earnings and findings month over month, year over year.
We’ve always found their blog posts both inspiring and impactful, and we’re hoping ours will do the same for you. It can feel a little odd to talk about these things so publicly, but we do it in the hopes that it helps your business and ours.
2020 has been awfully weird all around, but we’ve had some successes in Q3 that I’m excited to share with you.
So…let’s get into it. First, we’ll share our executive summary, cover the $1M+ businesses listed for sale right now, and then cover earnings for Q3 2020.
Executive Summary: Q3 2020 Report
Q3 2020 Business Data
Total team members: 71
Founders: 2
Sales team members: 16
Marketing team members: 8
Operations team members: 31
Engineering team members: 9
Human resources team members: 1
Finance team members: 2
Contractors: 2
Email subscribers: 139,698
Podcast downloads: 59,998
Site visits: 407,273
Brokered Site Sales
Listing fees: $6,819.00
Additional/other revenue: $50.02
Average deal size: $182,248.68
Total revenue: $16,584,630.10
Earnings
Brokered site earnings: $1,782,248.99
Listing fees: $6,819.00
Additional revenue: $50.02
Total gross earnings: $1,789,118.01
8 Seven-Figure Businesses for Sale Right Now
We currently have eight businesses for sale on the marketplace in the 7-figure range. In Q3, we sold a number of seven-figure businesses, many of which you can see as “pending sold” on the site.
We’ll get into the “why” later in the blog post, but there is a solid chance many of the businesses below will go fast, as more and more institutional buyers with deep pockets find our marketplace and begin to acquire digital assets.
- Listing #48704: A package deal of four affiliate sites for sale in the legal niche. Created in 2017, the business has shown strong year-over-year growth and supports diversified revenue sources. The business is priced at $4,263,138.
- Listing #48259: An e-commerce business in the apparel and accessories niche. Created in June 2019, the Shopify store 87 SKUS, an email list of 350,000 subscribers with a social media following almost 1,000,000 strong. The business is priced at $3,452,846.
- Listing #49207: An Amazon Associate and affiliate business created in the home niche. Created in November 2017, the site has diversified traffic sources with organic making up 75%, while the other 25% is performed through paid media. The business is systemized with SOPs and has a team of VAs that does the majority of the work. The business is priced at $1,828,323.
- Listing #47101: An Amazon FBA business in the gifts and occasions niche. Created in December 2016, the business operates in several Amazon marketplaces for diversified traffic and revenue and is part of Amazon’s Brand Registry 2.0. The asset also boasts strong year-over-year growth. The business is priced at $1,714,058.
- Listing #47242: A 2-site package of Amazon Associates and affiliate sites in the survival and security niche. Created in January 2017, the sites review a variety of tactical gear. The revenue is diversified with 80% coming from alternate affiliate programs and the remaining 20% from Amazon. The business is priced at $1,685,428.
- Listing #48344: An Amazon FBA and e-commerce store in the home and kitchen niche. Created in January 2015, the store features 208 SKUs that boast hundreds of positive reviews. The trademarked business is part of Amazon’s Brand Registry 2.0. The business is priced at $1,355,324.
- Listing #48865: A dropshipping business in the entertainment niche. Created in October 2017, the store features strong year-over-year growth and keeps no inventory, relying entirely on dropshipping. The store has a diversity of traffic from paid media (41%), organic media (34%), and direct media (13%). The business is priced at $1,155,810.
- Listing #47834: An e-commerce store operating in the entertainment niche. Created in April 2000, it is a custom-built site that helps users download a specific kind of file. Operating for over 20 years, it has provided the business a deep moat that makes it difficult for competitors to compete. The store supports diversified traffic with organic media (60%), direct media (20%), and referral media (14%). The business is priced at $1,063,297.
If you want to do your own due diligence on any of the above businesses, or really any business we’re selling, make sure you register for an Empire Flippers account.
It’s free, fast, and easy to do. Once you’ve signed up, you’ll also get access to a ton of advanced search features and tools to help you acquire businesses.
Alright, let’s dive into what happened last quarter.

Revenue Breakdown
Brokered Site Revenue
Here’s a look at our overall marketplace sales:
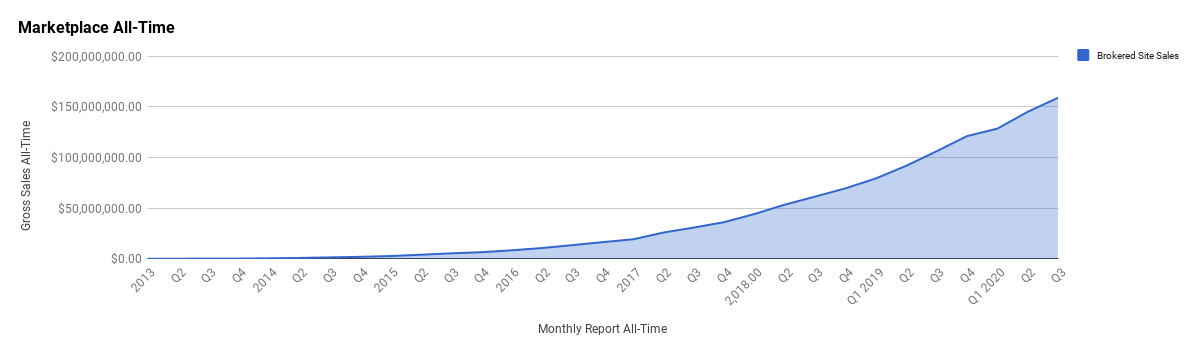
Overall, our marketplace continues with a solid growth trajectory. In Q3, we brokered $13,878,584.86 worth of online businesses, which is down a bit from Q2, where we sold $16,584,630.10.
Back in Q1, when we saw the pandemic starting up, we adjusted our growth goals down. These tempered expectations brought us back to our 2019 levels, and overall we’ve been beating those goals for the last two quarters. So far, as of this writing, we’re on track to beat our Q4 goal as well.
We’re planning to go back into full growth mode in 2021, with Q4 being the first real growth quarter for us goal-wise. We’ll transition into more aggressive goals for 2021.
Let’s take a more granular look at revenue broken down by quarter.
Below is a breakdown of our quarter by quarter growth:
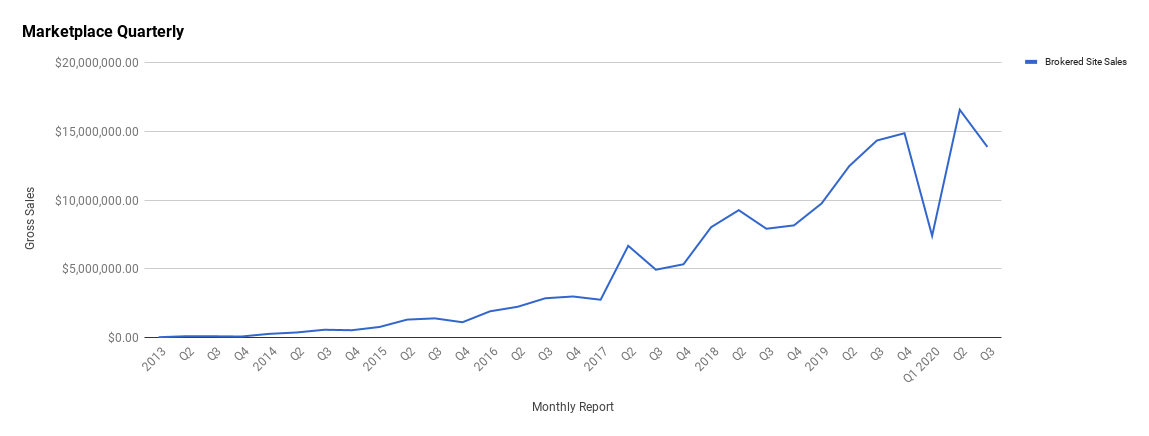
As you can see, the quarterly breakdown shows a much more dramatic story of the year. At the end of 2019, our growth trajectory started to struggle but still looked healthy overall. Then, Q1 2020 came like a wrecking ball. This was right in the heat of the hysteria as the pandemic began to spread globally.
After a bleak Q1, we saw the marketplace come roaring back in a big way.
Part of the reason for this is that many institutional buyers who had raised millions to acquire digital assets were holding off deploying capital in late Q1. Smaller investors were also holding onto their money, waiting to see where the world would go in the coming months.
In Q2, we saw the marketplace “normalize” to the new environment. While the world was still reeling from the pandemic, investors had grown more confident on where things were going and again began to deploy their capital.
What you’re seeing in Q2 is what private equity calls “dry tinder” in action. Dry tinder is private equity jargon for institutions with a ton of capital to invest that hasn’t been invested in any asset class yet.
Now that Q3 is over, you can see that the massive enthusiasm to deploy capital is slightly lower than in Q2. While it is lower, we don’t expect Q4 to be lower than Q3; if anything, Q4 should come in at more revenue from brokered deals.
Here is how our average deal size has changed over time on the marketplace:
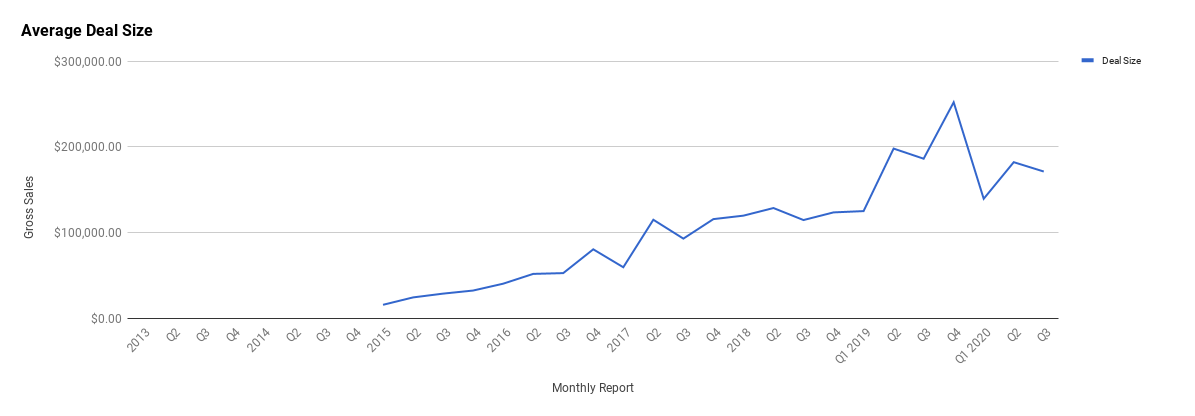
Our average deal size in Q3 was $171,340.55 versus Q2s $182,248.68. The two metrics are pretty close to each other, and we’re predicting that Q4 may see a rise from Q2s number, as we just closed our first eight-figure business on the marketplace.
We have now been tracking our average deal size for five years. If you combine all those quarters together, our average deal size over the last five years comes out to $190,433.88.
That is pretty crazy growth when you consider that in Q1 2015 when we first started tracking this number, our average deal size was only $15,893.81.
Q4 of 2019 still remains our biggest quarter in terms of average deal size, sitting right at $252,133.44.
While our average deal size has remained lower than that in 2020, we expect that to increase as we head into Q4 and into 2021 as we continue to focus on larger deals, close more 8-figure deals, etc.
There’s a bit of a chicken-egg problem with marketplaces. Nobody wants to list their $XXM listing if they’re not sure it’s going to sell. When we sold our first seven-figure business, it was the only one that had ever appeared on our marketplace.
After we sold it though, the floodgates opened and more seven-figure businesses started flowing in and getting sold.
There’s no reason to think this won’t be true for eight-figure businesses too. Keep an eye out on our blog for the case study we’ll be writing on that, hopefully, it’ll inspire you to reach new heights with your own business.
Business Listing Fees
In Q3, our listing fees were $1,370, which were greatly reduced from Q2s $6,819.00. We never made any real money from these listing fees, and close to the end of Q3 we got rid of listing fees completely, so it makes sense this number would fall dramatically.
We’ve charged listing fees to sellers for years in order to go through our vetting process, and it was always used as a filtering mechanism. If someone isn’t willing to pay $297 or $97, they’re probably not overly serious about selling their business in the first place. When our vetting team was smaller, it made a lot of sense to have this in place, but as we’ve grown, we’ve implemented other restrictions and filters that work just as well.
While this should help sellers with smaller businesses sell with us, it will also likely help bigger businesses sell with us too. The idea is to continue to attract 6-8 figure businesses (and their owners) by making it super-simple to list and sell on our platform.
So how are we going to filter seller submissions going forward?
We’ve come up with a simple but effective solution that takes the friction out of selling your business by not having to pay a listing fee, but also lets our vetting team know you’re serious about selling your business.
That solution is ID verification.
Now, when you submit your business with us, you will be asked to upload legal identification to prove you are who you say you are. Sounds like a very simple thing to do, but you’d be surprised how many people don’t do it and it still works as a fantastic first step filter before our vetting team goes about doing their five-minute check to see if your business will make it to the next step.
Alright, so that’s our revenue discussed, now let’s get into what happened on the brand growth side during Q3.
Traffic and Audience
Blog Traffic and Analytics
Our blog remains one of our largest traffic generators, though this has changed quite a bit since we implemented pagination on our marketplace.
The pagination saw a huge boost in organic traffic for us in all the right ways. We’ve begun to rank for a slew of high buyer intent keywords for our business, which is great to see. Still, we’re always producing content on the blog both for SEO-purposes and releasing interesting data studies that we think our audience will get value from.
Here are our traffic for Q3:
 In Q3, we saw consistent traffic with a total of 407,273 sessions, and out of those sessions we had 233,201 new users.
While traffic levels are very healthy, this is actually down from Q2, where we had 430,766 sessions and 240,464 new users. It’s a decent chunk of traffic that we’re missing out on, and the reason is likely due to Google updates, which seems to be growing an ever more constant headache for SEOs around the world—including a Google system-wide glitch with indexing.
Despite this drop, we actually had a fairly large increase in pageviews. In Q3, we had 1,668,759 pageviews versus Q2, where that number was 1,368,339, jumping up our pages per session by 1 for Q3 versus Q2.
In many ways, we’d prefer less traffic that is more engaged with the brand like this so the drop in traffic isn’t as worrisome as it might first seem.
It’ll be interesting to compare Q4 vs Q3 due to an on-page SEO project we’re currently working on. While that project won’t be finished in Q4, it’ll be pretty close and will hopefully bear some fruit.
Here are our top referring channels:

There’s nothing too surprising here. You’ll notice there is a brand new referral on here, well, brand new in the sense that it made it back to one of our top referral channels—Quora.
In Q3, we went pretty hard after Quora, and while it is great to see it making it on the top referral charts for us, the project was ultimately a failure for us. I’ll go more into why that is down in the updates section, as it’s a great lesson of testing what many leaders in content marketing say to do ending up not working quite as well as advertised.
We’ve gotten decent traffic from YouTube this quarter, but that is also down from Q2. In Q3, YouTube gave us 1,534 visitors via referral traffic versus in Q2, where we had 2,891. Why the sharp decline? Well, we’re not quite sure.
Part of it could be because of the new UTM links we’ve been adding throughout both our YouTube channel that features seller interviews and our YouTube channel that features more talking head educational content.
Though, that wouldn’t explain the majority of the drop.
Another reason could be that there were a few videos not produced by us, but rather by other YouTube channel creators that went live in Q2. That might be where the traffic decline really sits, as other content creators hadn’t done a video about us on their channel in Q3, or at least not as many, and the videos may not have been as popular as the ones in Q2.
While YouTube did decline, it has so far been quite the useful tool for us in other ways, such as reactivating contacts within our CRM to take positive actions with us, like selling their business or registering an account.
So what was everyone in Q3 looking at when they came to the Empire Flippers website?
Let’s hold up our magnifying glass and take a look.
Here are our top three most viewed pages:
Here are our top three most viewed listings:
- Listing #47459 (SOLD!): An Amazon FBA business in the personal care and bed niche. Created in January 2016, the brand is trademarked in the USA and the UK. It is also part of Amazon’s Brand Registry 2.0 program. The business is priced at $11,883,060.
- Listing #47198 (SOLD!): An Amazon FBA business in the health niche. Created in October 2016, it features three SKUs that are part of Amazon’s Brand Registry 2.0 program. The business is priced at $2,474,495.
- Listing #48163 (SOLD!): A lead gen business in the equipment niche. Created in November 2018, it experiences year-over-year growth. The business is priced at $15,895.
Here are our top three most viewed pieces of content:
- The Most Popular Online Business Models
- How to Start an Amazon FBA Business
- [CASE STUDY] How We Sold a $93,077.32 Merch by Amazon Business in 19 Days
Here are our top three most viewed recent pieces of content:
- Set Up and Start Selling: How to Create Your First Amazon Seller Account
- How to Make $50K, $100K, or $500K Online
- How SaaS Valuations Work: Multiples, Metrics, and MRR
Podcasts and Shows
Podcasting remains a strong marketing channel for us.
Podcasts in general work great for our industry, as they lend themselves to being more long-form than other mediums. Since buying or selling a business can be a complex, challenging, and emotional process, podcasts just work incredibly well at explaining the nuances of how it is done.
We’ve been podcasting for years at this point, and we just added a new show to our roster—The Opportunity.
Let’s dive into how well each of these shows did.
The Empire Flippers Show
The Empire Flippers Show remains our flagship show. In Q3, we published multiple new episodes, and in Q4 we’re continuing to do so, which is helping in terms of downloads.
The Empire Flippers Show features our co-founders Justin Cooke and Joe Magnotti. It covers everything from them deep diving into a specific aspect of buying and selling, industry news updates, and thorough interviews with a variety of business leaders doing amazing things with their online businesses.
Here are our downloads in Q3:

As mentioned above, a consistent publishing schedule remains one of the best things we can do to grow our downloads. In Q3, we had 39,147 downloads, which is more than double what we had in Q2, where the podcast had 18,175.
If you want to give a listen, you can check out the podcast here.
Here are our top three most listened to episodes for the quarter:
- EFP 202: Brokering Porn Websites
- EFP 204: What Business Buyers Want In 2020
- EFP 203: From Brokering Yachts To Websites
The Web Equity Show
The Web Equity Show remains one of the best podcasts around if you’re starting out in buying and selling digital assets. The reason?
Each season focuses on a single theme.
This means we have an entire season dedicated and structured just for people starting out, people who are looking to buy, sell, and even one all about going to the next level in terms of creating funds.
The Web Equity Show is co-hosted by Justin Cooke and our friend Ace Chapman.
Here are our downloads in Q3:
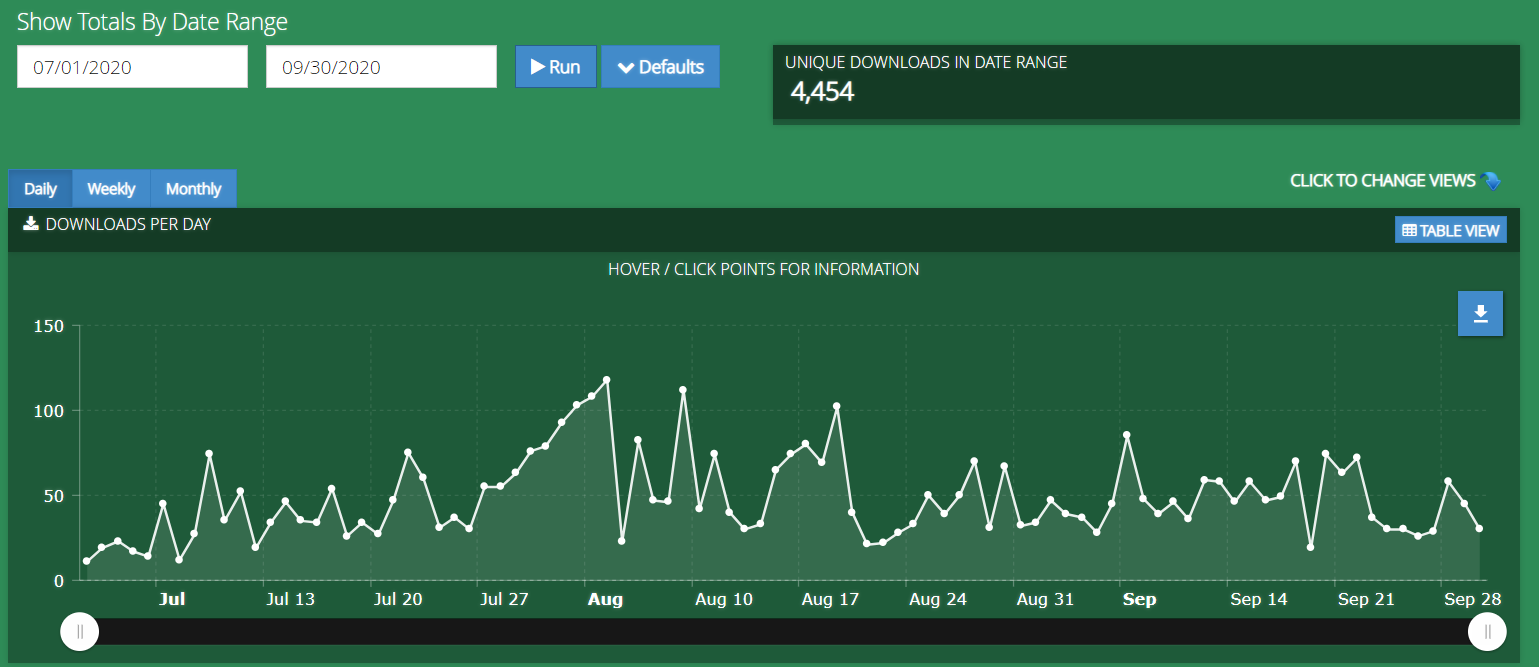
In Q3, we had 4,454 downloads for the quarter, which is less than Q2, where we had 10,109.
The dip in downloads makes sense as we didn’t publish anything in Q3 for the podcast. The nice thing from a marketing perspective on these is that almost all the episodes are evergreen content.
We use that evergreen content in a variety of ways, but mostly in the long-term based on the various email funnels we’ve created.
If you want to give the show a listen, you can check it out here.
Though, if you’re new, I would recommend checking out Season 2 and Season 3 as a guide to both buying and selling online businesses.
Here are our top three most listened to episodes for the quarter:
Real Money Real Business (RMRB)
RMRB is where we feature all the interviews we do with sellers that have made it on our marketplace, as long as their business is being sold for $50,000 or more.
These interviews are hosted by a variety of members of the content marketing team, right now the hosts are Craig Schoolcate and Vincent Wong. Each interview dives into who the seller is, why they are selling, and a bit of the journey that made the business profitable in the first place.
While the interviews are meant to help buyers get comfortable with the seller and to understand the business a bit better, they also serve as inspiration for those just starting their digital journey and building out their own assets.
Here are our downloads in Q2:
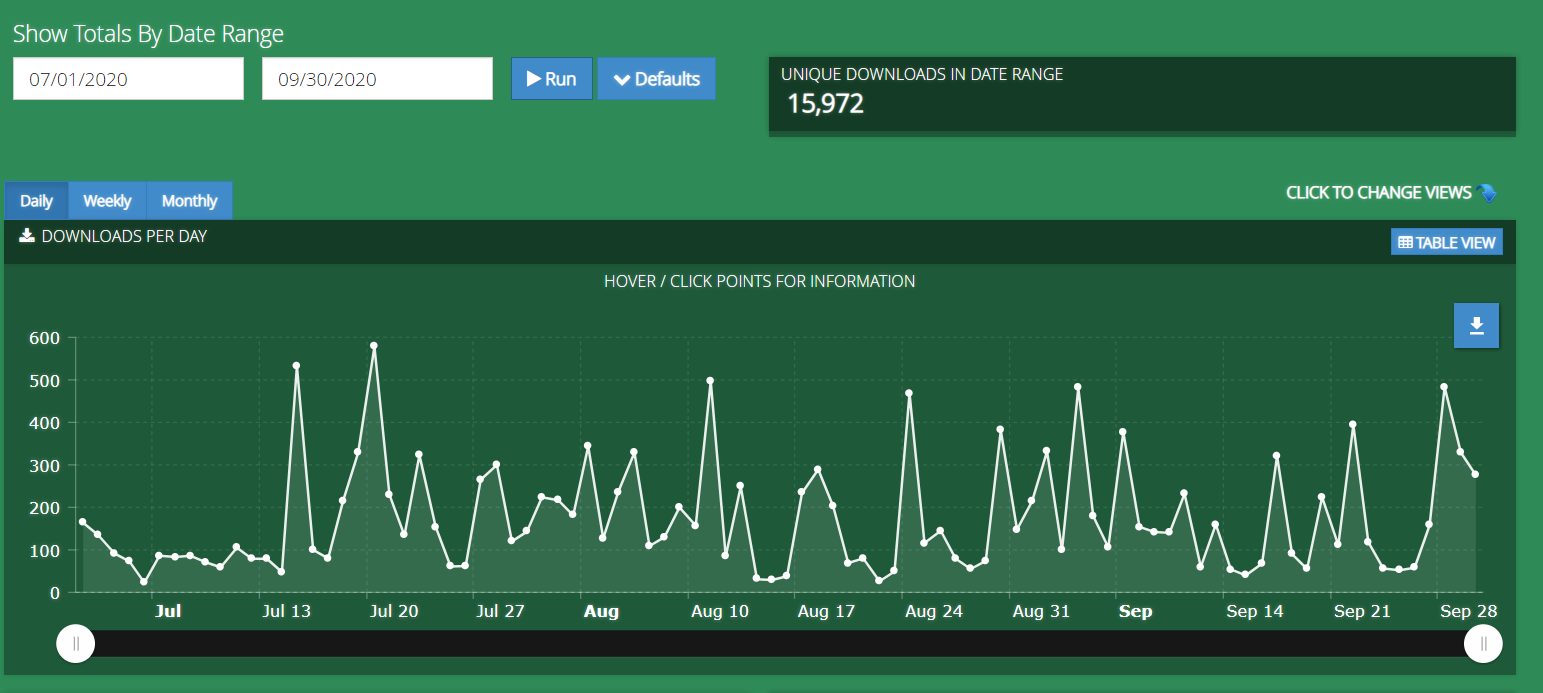
In Q3, we had 15,972 downloads for RMRB, which is slightly more than Q2, where we had 15,862.
Outside of the Opportunity podcast (see below), RMRB is our most consistent podcast we produce. It is also by far our most prolific podcast. Despite that, it is still published on an irregular basis.
This is because we can only do episodes if we have the (right) sellers. On any given week, we have a couple of seller interviews. Although, sometimes on a BIG listing week we may get 6–8. So, while it is our most consistent podcast, the publishing schedule is not. Instead, we just publish them as soon as they’re ready to go to help serve our purpose of marketing the businesses we have for sale.
It wasn’t initially designed to be a podcast, but rather just something we put up on YouTube for the listing pages. It has since evolved a bit, and probably could do with even more work to make it better as a podcast.
Interestingly enough, the podcast channel was just a syndication play when we began uploading there. Over time, our podcast channel has begun to outproduce what the YouTube channel produces for the seller interviews.
If you want to check out our latest seller interviews, you can give it a listen here.
Here are our top three most listened to episodes for the quarter:
- RMRB 167 – Building a Huge Moat Around a Million-Dollar Affiliate Business With Even More Room to Grow
- RMRB 165: Working 2 Hours a Week While Profit Balloons 10X Over 6 Months
- RMRB 158: Creating a Hands-Off Amazon Associates Business That Qualifies For Other Monetizations

The Opportunity
The Opportunity is our newest show and is co-hosted by our content specialists Sarah Nuttycombe and Branden Schmidt.
The Opportunity was created to fulfill two specific content gaps I saw in the industry:
- Not enough content and stories from a buyer’s perspective. What actually happens AFTER they acquire the business?
- Not enough content giving deeper “inside baseball” perspectives from people working full-time in the buy and sell industry.
Both of those ideas were supposed to be two different podcasts when I originally came up with them. Instead, we ultimately ended up rolling them together into The Opportunity.
In every episode, we interview one of the many buyers that frequent our marketplace. We discuss how they got the financing or capital to buy the business, their due diligence process, how negotiations transpired, and what actually happened once they took the reins.
The stories are as varied as they are inspiring.
So far, we’ve covered entrepreneurs at all levels, from people building out affiliate site portfolios to institutional buyers raising hundreds of millions in capital by acquiring Amazon FBA businesses.
In addition to interviewing buyers, we also interview members of the Empire Flippers team. This is the “behind the scenes” kind of content that gives you a deeper look at how certain processes work, such as vetting or migrating a business.
One of our latest episodes is with our director of sales Alex Champagne, where he breaks down the evolution of private equity in the buy and sell space. You can check it out here.
At the end of every episode, you’ll also get to hear about a business we have for sale that matches the theme of the episode. All of this will hopefully help the audience grow more educated and help them decide what kind of businesses they should be doing due diligence on for their personal and business goals.
You can see the latest episodes here or download them on Apple Podcasts, Spotify, or Stitcher.
If you enjoy the show, we’d love it if you left us a review since it’s a new show and every review helps us get our message out there. Plus, we’ll give you a shoutout and answer your question on air.
Here are our downloads in Q4:
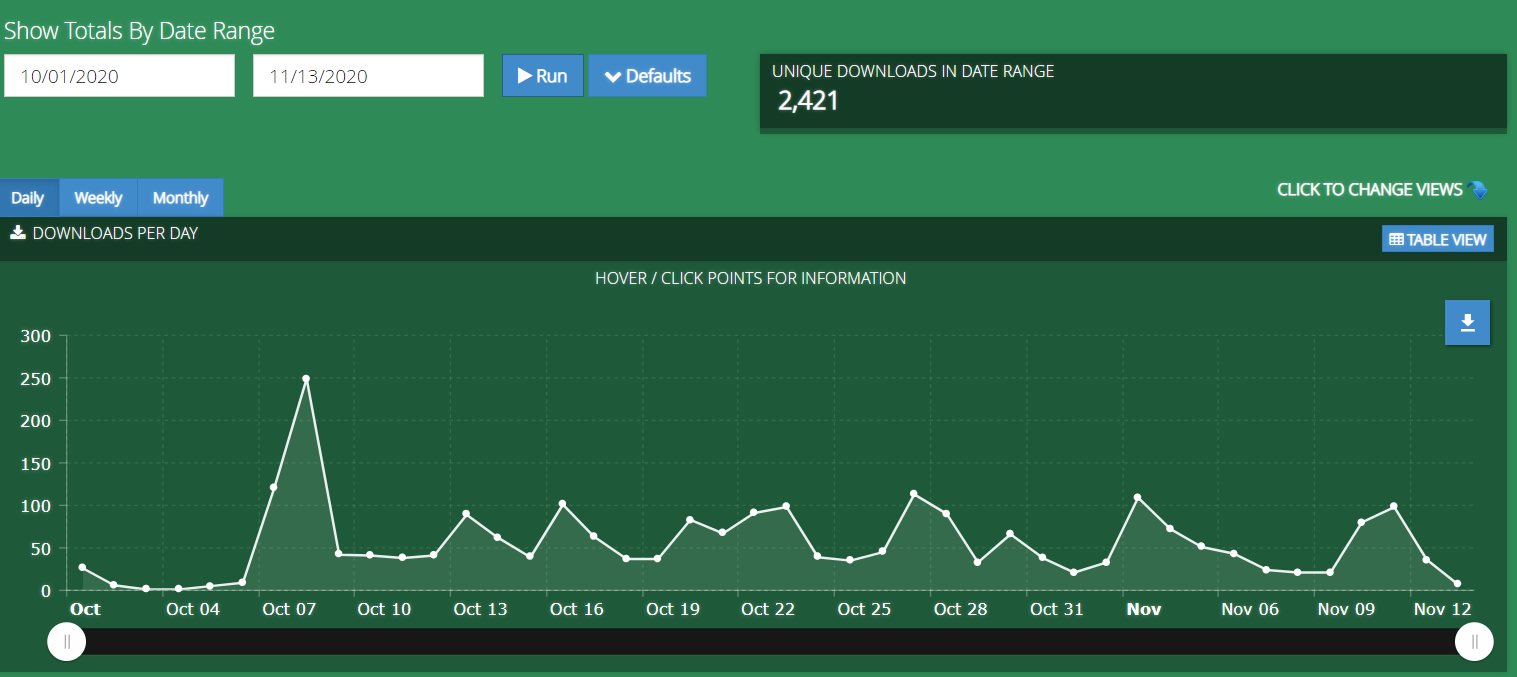
Now, this chart is a little different from the others.
Namely… the chart shows the downloads we’ve had so far in Q4 instead of Q3. The reasoning behind this is that we launched this podcast literally on the last day of Q3; therefore, you would’ve only seen a chart with six downloads.
Instead, this is how the podcast is doing so far since we launched it at the end of Q3.
We’ve had 2,421 downloads so far (halfway through Q4). While this is not a ton, I do think this is a positive sign. The co-hosts are brand new to podcasting, and their skill level is growing with each new episode.
Over time, we believe this podcast is going to be a solid performer for us, and we have already gotten great feedback from our audience.
We publish one episode per week (every Tuesday) featuring the newest interviews.
Come and give it a listen, and of course, if you enjoyed the podcast we’d love it if you left a review.
Here are our top three most listened to episodes for the quarter:
- The Opportunity Ep.2: How to Successfully Build and Run a Portfolio of Amazon Associates and Affiliate Businesses
- The Opportunity Ep.3: Using Content to Scale Your Own Empire
- The Opportunity Ep.6: Navigating Ups and Downs with Affiliate and Display Advertising Businesses
Email and Contacts
Email marketing remains a core marketing pillar for us.
We’ve tried to simplify our funnels more. For anyone running a powerful marketing automation tool like Hubspot, you have probably had the experience of building too many workflows, too many rules, properties, and something going haywire.
It can be a real mess! Especially when you have to untangle it all.
However, over the last three quarters or so, we’ve been able to simplify our process even more. Moreover, we had some fantastic success in Q3 where we implemented a re-engagement campaign with our contacts.
It was a simple email where we offered a lead magnet either related to buying or selling a business—depending on where they were in our email funnel—when they became unengaged.
We had a pretty humble goal of winning back 5% of our subscribers but managed to get 17%. That number is actually growing considerably and continues to do so this quarter because we’ve put the re-engagement campaign into an automation sequence.
If you’re running a big email list and notice you have a sizable chunk of contacts that have not engaged with your brand in 90 days or more, it can very much be worth your time to reach out to them with something they might find interesting.
Since we’ve done this, many of these contacts coming back to engage with us has led to valuations, registrations, and in general real business for us.
Let’s take a look at some of our numbers in Q3.
Here is a chart of our subscriber growth in Q3:
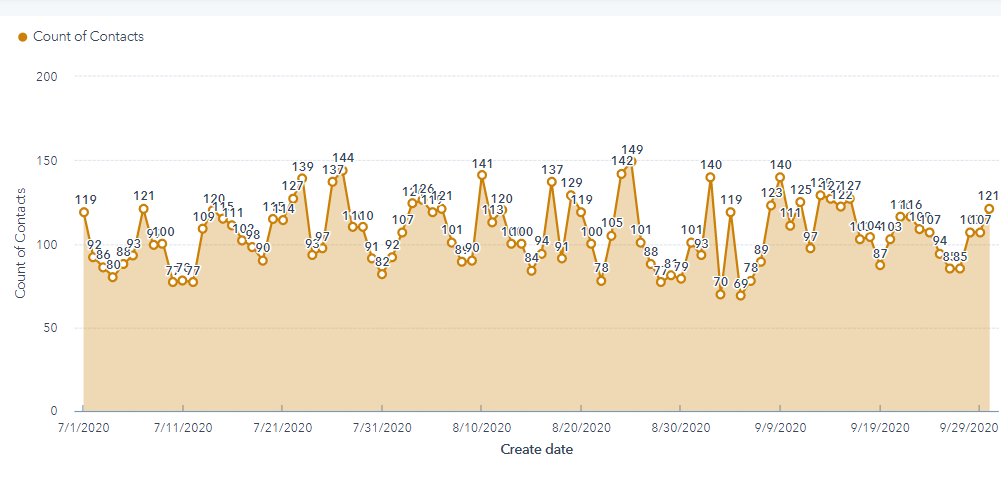
In Q3, we generated 9,715 new subscribers to our email list, a sizable chunk above last quarter, where we generated 9,186 new subscribers.
A portion of this uptick comes from our renewed effort on SEO. As you can see below, SEO is our main channel in generating new subscribers.

Right in second place is every marketer’s favorite channel… direct traffic.
This, of course, is followed by our next favorite channel… offline sources.
Direct traffic and offline sources are traffic we haven’t been able to track in terms of where they initially heard of us. It is likely though, that they have come from the plethora of podcasts we do, both in-house and on other shows, and other content channels where we just can’t track people that hear of us and type in the name directly.
Still, a healthy amount of direct traffic isn’t all bad. It shows that people are actively hearing your brand, whether via referral or some other piece of content, and are actively pursuing to know more about your brand.
We have been dabbling more in paid search and we’re still convinced there is major potential for us there, but the vast majority of these contacts have come from our branded campaigns i.e targeting our own name with Google Ads.
Here is our list size growth over the past year:
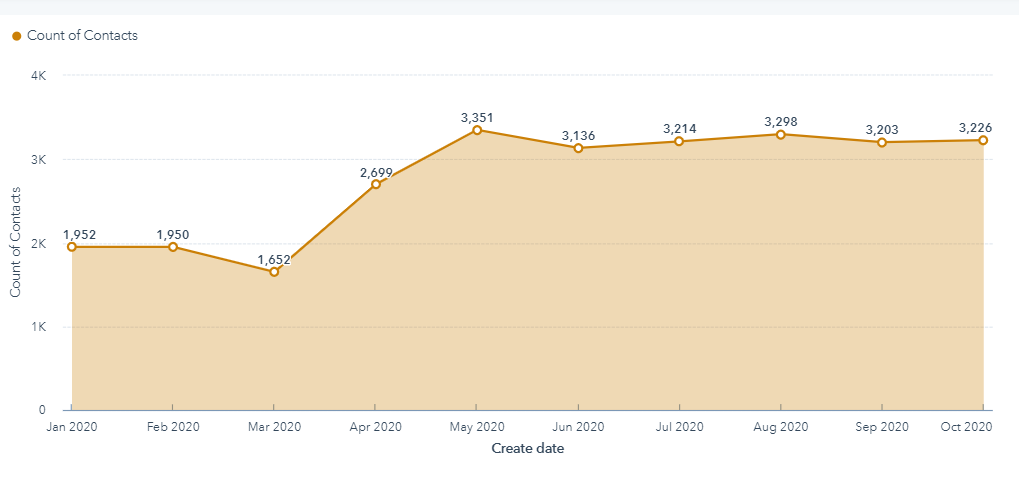
The chart above shows our subscriber growth throughout 2020 up to the end of October so far. We had a huge uptick around March, which is also when a ton of new SEO traffic started rolling into the website. In addition, it was earlier this year that our marketplace update took effect, which allowed the entirety of the public marketplace to serve as a gigantic lead magnet for us.
As you can see, it’s been working pretty well!
In addition to all the above, we’ve been optimizing our email funnels even more. We’re not just optimizing for the metrics though; we’re also optimizing them for the content we give you.
We’re not where we want to be yet, but we work hard at developing more content in the backend of our email funnels to provide you with a ton of value. Our hope is that this remains true whether you’re a buyer or a seller, or even just a digital entrepreneur.
Our valuation tool emails have been performing well since we made our large change to that funnel.
A while back we created brand new funnels, so when someone with an affiliate site fills out the valuation tool, they’ll get a completely different set of emails than say an e-commerce entrepreneur or a SaaS founder. Each email funnel is designed specifically to help that business model owner find the best way to sell their business and things to watch out for when they do decide to sell.
If you’d like to see the emails, just fill out our valuation tool here with your business.
On the buy side, it’s been a bit more difficult regarding how we want to go about creating specific buyer funnels that match the different types of buyers out there. Though, it is on the docket here in the next few months to finally revamp that section of our funnel.
If you’d like to see more of our buyer emails and how they might help you in your journey, all you need to do is register for an Empire Flippers account.
Customer Experience
Zendesk remains our workhorse for the majority of our customer communication. We’ve also implemented live chat across the entire website both in and outside of our marketplace. If you ever need to reach us, just open up the tiny chat bubble to your right and send us a message.
We’ll be happy to answer.
Customer experience in general is always top of mind. Selling or buying a business is an emotional and challenging experience, even in the smoothest transaction. There is a lot of nuance to know, and a lot of speed bumps to overcome.
This is exactly why we track a variety of customer experience metrics to try to do better every time.
So how did we do in Q3? Well, let’s see what our customers had to say.
Here is a look at our customer feedback:
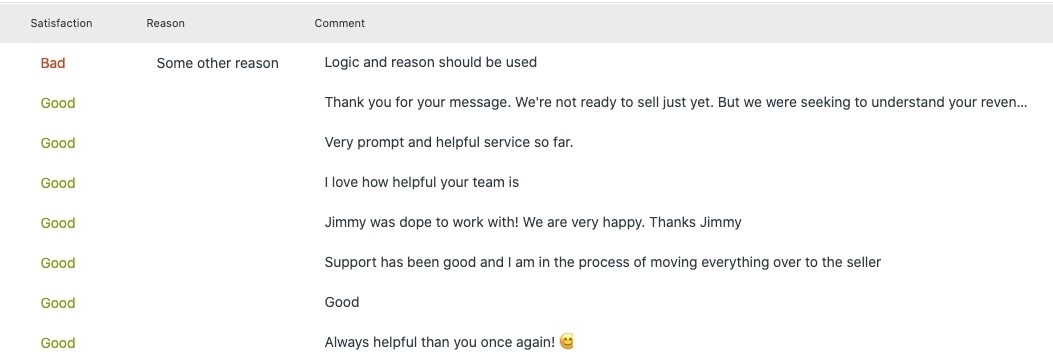

As you can see, the majority of the feedback has been positive for us. The majority of the bad feedback was related to not listing someone’s site that our vetting department didn’t approve.
Though, we did get one bad feedback related to our Proof of Funds process, where we verify how much capital you have to give you the ability to unlock businesses. The concern was on the security of that documentation, which is an understandable fear.
We use some of the best-in-class security measures. If you’re curious to know a bit about our stance on security, you can check out our page here that describes a variety of things that we do. Of course, nothing is 100% secure, and this fear is still understandable despite us doing as much as we can.
While we have dropped the ball in some areas when it comes to getting back to people, for the most part, people have been very happy with how responsive our team is. This has always been a work in progress for us, and especially tough considering our audience is global. Still, we’re constantly at work improving the experience.
In addition to the customer feedback in our Zendesk portal, we also recently took control of our Trustpilot profile. Here’s a snapshot of our Trustpilot rating:
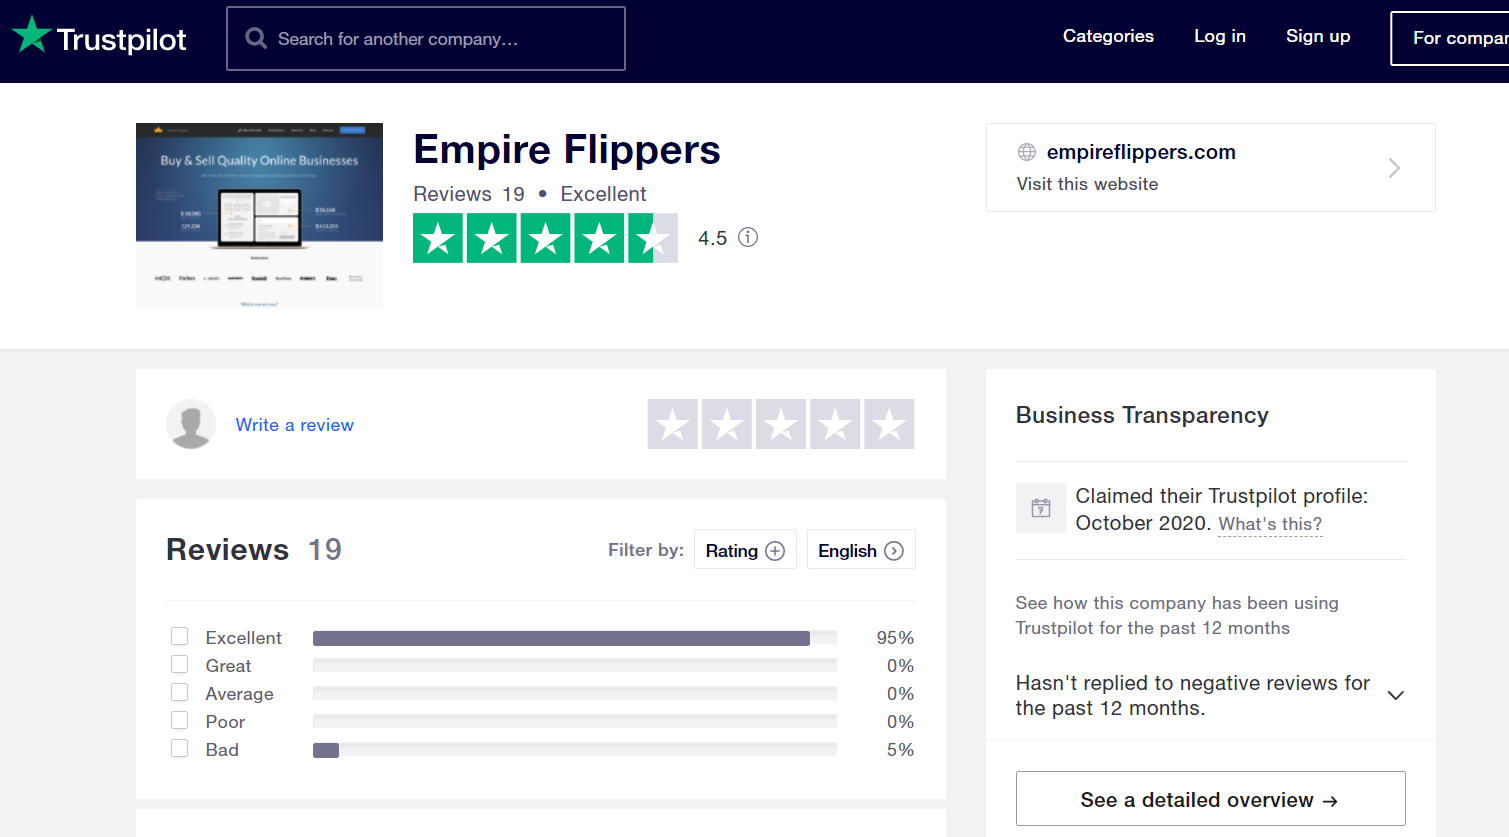
So far, we only have 19 reviews as of this writing, so if you’d like to leave a genuine review for us on Trustpilot, you can follow this link.
We always appreciate honest and transparent feedback, so we’d love it if you left a review of your experience with us.
What Happened in Q3 of 2020?
The world is still locked down for the most part, and thus a quarter that is usually filled with conferences was rather silent for us. Despite the lack of conferences, the quarter felt busier than ever, just in a very different way.
We had plenty of events across the quarter, even if they were more socially distant events.
Let’s dive into it.
No Listing Fees
One of the biggest changes to our marketplace in years is the removal of our listing fees.
We used to charge $297 for first-time sellers and $97 for returning sellers. The listing fee was never a big moneymaker for us, but it was an excellent way to filter out people who were serious or not when it came to selling their business.
We held this fee for a long time. When our company was smaller, it made far more sense, as we absolutely needed a filter in order to handle the volume. Now that we have a full-fledged vetting team though, there is less of a need for this.
Late in Q3, we removed the listing fees just to see what would happen. We had a huge influx of seller submissions coming through. Unfortunately, we also had a huge influx of not great businesses being submitted.
This led to an even higher rejection rate by us, which was already hovering close to 90% before we removed the listing fees. However, it has also led to some great businesses being submitted.
At the end of the day, the listing fee caused friction for the seller, something we try our best to remove. Now that our operations team can handle larger amounts of seller submissions, it just no longer made sense to have it.
One of the things we added to our seller submission process to act as a “new filter” is the ID verification process—something that is done with sellers anyhow but usually later in the process.
When you submit your business for sale, you’ll immediately be asked to verify that you’re a real person using legal identification. Only when that is completed will our vetting team then begin the process to get you ready to sell on our marketplace.
If you’re ready to sell your business, you can check out the new no-fee submission process here.
Expanded the Sales Team
We expanded our sales team once more.
We’ve added more business analysts to both our buy and sell side teams. A while ago we realized that we could serve our customers better if we divided the sales team into two separate categories. Initially, we only had two salespeople dedicated to sellers looking to exit their business.
The success of that decision made it clear that we needed more people to serve our sell-side audience. We’ve now doubled that team and added more buy-side salespeople. Part of the reason why we added to both is due to a few of our team leaving us to go and explore other opportunities. This is a fairly natural thing to happen in sales roles, and we wish them the absolute best.
While we’re excited to see what they do, we’re also excited to see what our new batch of business analysts will accomplish. After hiring several rounds in the sales team, we’ve refined our training processes and systemized our on-boarding process even more.
What this all means is that this round of salespeople are already hitting the ground running, helping buyers close deals and giving counsel to sellers to help them get bigger exits faster than ever before.
Expanded the Operations Team
In addition to expanding the sales team, we’ve also expanded our operations team by adding several new vetting advisors and migration advisors.
Now that there is no listing fee to submit a business with us, we needed extra vetting hands to manage the much larger flow of deals coming towards our marketplace. We’re already seeing the fruits of this labor with our weekly output of new listings, which is the highest we’ve ever had on a consistent weekly basis.
The more listings we can publish on the marketplace, the better we tend to do, so this should have some long-lasting impacts on our revenue growth. Similar to our sales team, we’ve improved the process of on-boarding team members into our operations, and they have already had a positive impact on managing the increased flow of deals.
New Registration Page
A large shift has occurred in our marketing focusing on getting more people to sign up for an Empire Flippers account. Before, we only had the “Register” button that you see at the top of our website where people can set up their account or login to the marketplace.
We decided we wanted to go one step further and created a page that lists all the benefits a buyer gets when they register for an Empire Flippers account. It is effectively a sales letter that we can use in our content to drive more people to the marketplace.
You can check out the page here.
If you’re wondering what the actual benefits of getting an Empire Flippers account is, then read that page to explore all the variety of features we’ve built to help you find your perfect acquisition at record speed.
Too Low Multiples (And… the First Real Seller’s Market?)
Out of all the brokers in our space, it is likely we are the strictest when it comes to how we give valuations. Our goal is to never entice a seller to sell with us, but rather to give them the real market value of what buyers are willing to pay.
Some of our competitors will promise the moon just to get a seller to sign up with them and then talk that seller down on their sales price, telling the seller they need to be more “realistic.” Obviously, this is a very frustrating experience for the seller, which is why we only ever give the realistic valuation to begin with.
After studying the market both on our marketplace and in other areas of the industry, we’ve realized that the increasing demand for digital assets also increases the actual sales multiples for these businesses.
We are now moving up the multiple range we give to businesses looking to sell. This is especially apparent in businesses that are seven-figures or more.
Our prediction is that multiples, at the very least, will continue to rise to meet demand all the way into Q1 2021.
What this all means is that for perhaps the very first time, we’re starting to see a real seller’s market starting. Buyers are not batting an eye at the increased multiples, and sellers are selling their businesses for more than ever before.
We would never tell you to sell your business by trying to time the market. There is just too much that goes into something like that, and it is too easy to be wrong. Instead, we always tell sellers to sell their assets when it helps them accomplish their personal or business goals instead.
Still, if you’re a seller wanting to sell, right now is the best time we’ve ever seen to do it.
Live Chat!
We’ve recently created a new subdepartment in our operations team that has a heavy focus on providing live interactions with our customers. If you already have an Empire Flippers account, you might have already talked with our new chat specialists via the live chat windows we have inside the marketplace.
For the rest of our website, we had an automated chat function. At the start of Q3, we created new and complex re-workings of our automated chat that could lead people down different paths based on what they wanted. Sadly, this was a failure in that our scheduled meetings went way down and there wasn’t any other positive payoff for the effort the marketing team put into it.
Because of this, and because of the chat specialists being up to speed, we’ve decided to test live chat across our entire website, whether you’re logged in or not. You can open up the chat bubble in the bottom right corner and speak with our team anytime you want.
Whether you have a question on the selling process, the buying process or something else, our team is there to answer your questions in real-time.
If you have a question, go ahead and open up that chat bubble and say hello!
The Long Slog of On-Page SEO
In Q3, we continued our efforts to update hundreds of blog posts, content pages, and landing pages across the website. We completed over half of the blog, and by the end of Q4, we should have only a handful of content left to update.
We’ve recently signed up with Clearscope for this, and we’re excited to see what results might come out of the effort.
SEO has always been our favorite channel to drive new traffic to the marketplace, and 2020 has so far been a record year for us on this front.
We’ve turned Clearscope into a core part of our on-site content creation process. Therefore, every article going forward that has an SEO-goal will be run through Clearscope. It remains to be seen if this will be something we continue to do, but right now we’re just focused on finishing the website optimization so we can measure the results we’ve produced.
Testing Quora
We were inspired by our friends over at Ahrefs to give organic Quora marketing a real try. They wrote an excellent guide on Quora marketing here and we wanted to see if we could reproduce their results.
Sadly, we did not.
We spent all of Q3 answering as many questions as possible, both older questions getting a ton of views and new trending questions.
Here are our Quora stats for Q3:
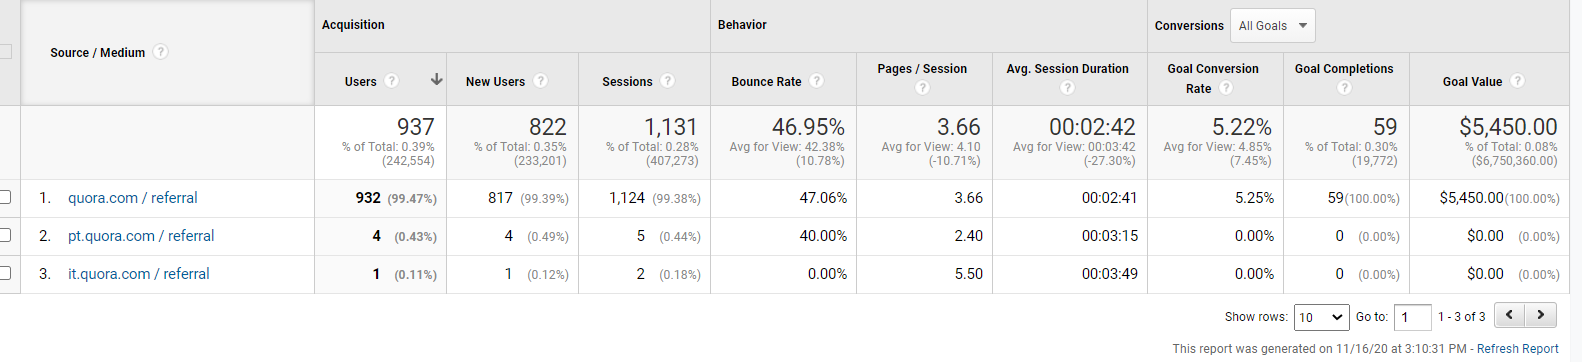
As you can see, we did drive traffic and we actually did achieve positive goal completions. We drove just under 1,000 visitors at 937 and completed 59 goals for a goal value of $5,450. On a granular level of labor cost versus what was generated, Quora was a profitable channel for us. We did more than break even, but only barely.
The amount of effort that went into answering so many questions ultimately wasn’t worth it for us, and we didn’t see any added SEO benefit from the backlinks we earned from Quora.
We will likely always answer questions on Quora when it comes to specifically buying and selling digital assets, but for now we’ve decided to forego having a consistent answering process every week.
Could Quora work in other niches? I think it probably would, especially niches that are much broader than internet marketing. Alas, for us, it just didn’t seem to be worthwhile.
Educational YouTube Channel
We continue publishing to our educational YouTube channel here.
Here are the stats from Q3:
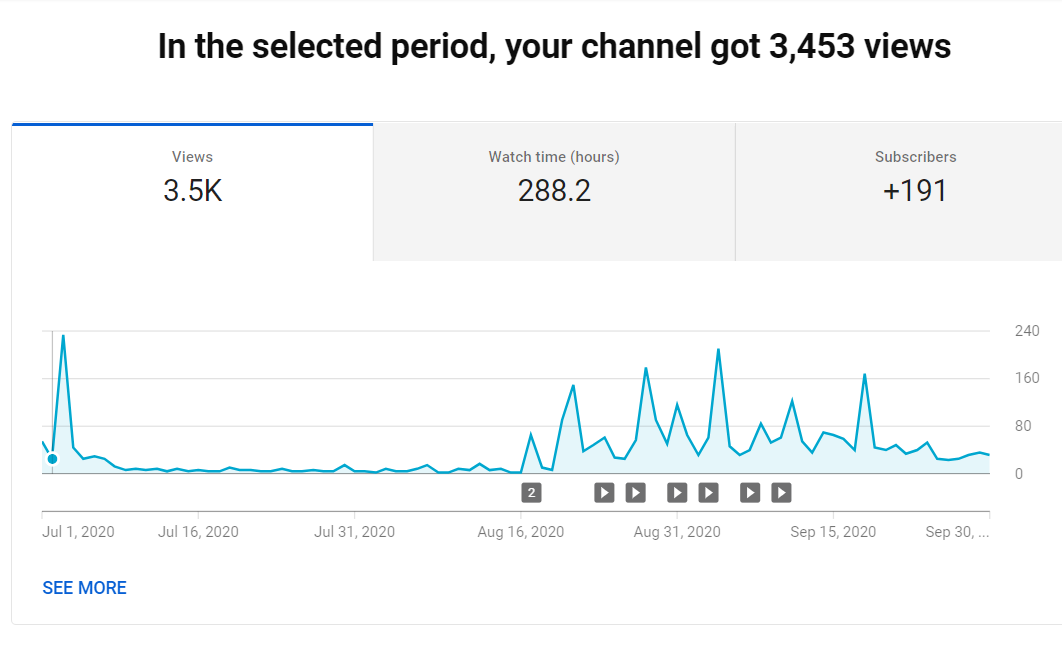
Our publishing schedule was nowhere consistent enough for my liking, and it does take quite a bit of effort to produce these videos. Still, I am happy with these results, even if they are small enough compared to most other YouTubers to not be worth doing at all.
Luckily for us, our LTV is so large that even this small amount of traffic can have a pretty meaningful impact on what we do. We’ve been able to use the YouTube channel to not only drive new people to our marketplace, but to also re-engage our old contacts to sell their businesses with us, unlocking new businesses to buy and a few other core metrics that we’re pleased about.
Here are the top five videos we published in Q3 on our YouTube channel:
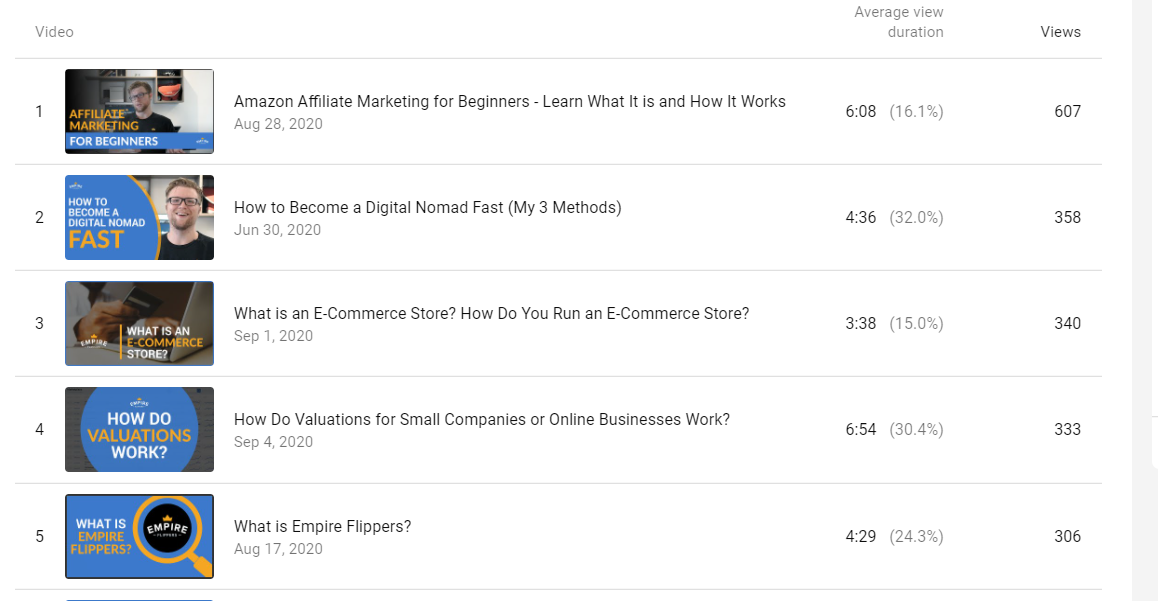
Most of these videos were part of our initial batch of SEO-driven videos. We used Ahrefs to find out how often these keywords were being searched for on YouTube and decided to try to rank them—with mixed results.
We are getting organic views every day now, but as anything with a new content marketing push, it is slow going until you reach a certain threshold.
As of this writing, we’re close to doubling our total amount of subscribers in Q4, which is right on track for where we’re hoping to be.
Here is a look at just a few of the results we’ve gotten from the channel:
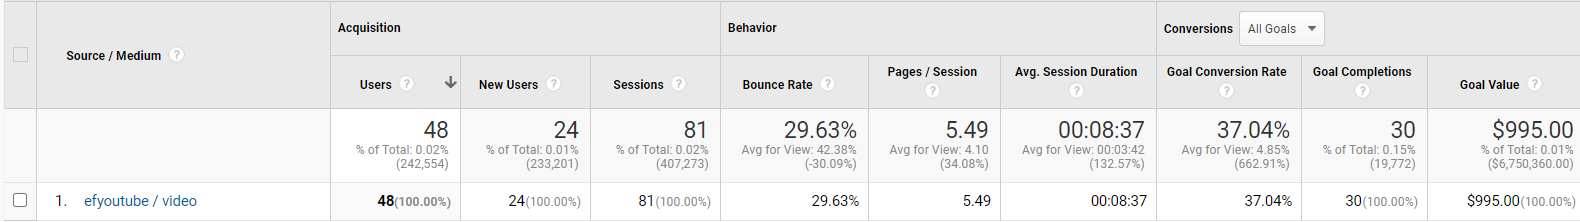
The above image doesn’t describe the actual amount of traffic we’ve gotten from this channel. Instead, it is only tracking the UTM links we used in the video description. So, we’ve actually gotten much more traffic and have likely completed far more goals than this, but these numbers are specifically from people that scrolled down to the video description and clicked the link.
As you can see, while the traffic is low, the actual conversions are quite high. In our business, our lifetime value per customer can be so dramatic that these small numbers can actually reflect hundreds of thousands of dollars in potential revenue for us.
We’ll continue publishing more videos in Q4, and as the content team develops better systems to start running like a well-oiled machine, we think publishing 1–2 videos per week will become much more possible.
In the long run, we still think YouTube is a sleeping giant for us. We’re excited to wake it up and see what happens next.
Sub $100k Deals Automated for Faster Deal Making
In Q2, we introduced automation for businesses that were valued at $75k and under. In Q3, we raised the sales price for automated deals up to $100k.
The working theory was that our systems have become developed enough where buyers and sellers don’t really need a business analyst actively interacting with them at this stage. This allows buyers and sellers to communicate back and forth through our communication system to get the deal done on their own. Since most of these deals are sold at or very close to list price with all-cash offers, they’re far less complex deals than say a multiple seven-figure business that might have multiple revisions of contracts and agreements.
In Q3, our theory turned out to be correct for the most part. We’ve been able to sell these deals at $100k with minimal interaction by our sales team.
That being said, all tickets and communications are being reviewed and we’re ready to step in if we think we can help.
These deals still go through our normal vetting process. When the deal is sold, it then goes through our migration process like any other business would.
We’re not sure if we’ll raise it higher than $100k as we are likely to see diminishing returns of usefulness for our buyers and sellers once we get above a certain level.
One Billion Dollars In Available Funds
Just as we’ve gotten rid of our listing fees, we also got rid of our deposit process a while back. Now, instead of making a deposit, our buyers perform an “unlock” on a business.
In order for buyers to get unlocks, they must first show their proof of funds. What this means is that they must show us that they have the actual capital to buy the business they’re looking at. If they don’t have the capital to purchase, then they cannot unlock the business to do deeper due diligence.
This has worked out great for us in that we no longer have to pay the Stripe refund charges, and we are still able to filter out buyers so our sellers are only talking to the most serious possible acquirer of their business.
Since we started this proof of funds method, we’ve also kept track of the verified liquidity of our marketplace.
At the start of Q4, we had a very interesting thing happen.
We crossed over a billion dollars worth of investable liquidity that our buyers have in aggregate across the marketplace. What this means is that we’ve done so much proof of funds that we can now say with certainty that our marketplace has a billion dollars worth of liquidity to acquire digital assets.
That number was shocking to us but also proves what we already knew—the market for buying and selling digital assets is heating up in a big, big way!
From Six to Two Month Exclusivity
Another big change to our marketplace was decreasing our exclusivity period. We used to have a six-month exclusivity wherein, if you decided to sell with us, you agreed to give us six months to find you a buyer.
This was one of the longer exclusivity periods in the marketplace, and sellers understandably didn’t like the idea of potentially locking up their business for six months. We decided to take a hard look at this in Q3.
The data we looked at showed that the majority of the businesses we sell on the marketplace sell within a two-month timeframe.
So, we’ve decided to drop the six-month exclusivity, for now, to test out how a two-month exclusivity would perform. We believe it’ll work out well based on the numbers we reviewed. This also allows us to say we have one of the shortest exclusivity periods of anyone in the industry now.
We’re hoping this change gives more reserved sellers the confidence to give us a chance when selling their business. When they do, we’ll most likely get them a deal within that two-month timeframe so they can have an awesome exit experience to the point where they will use us again.
Of course, we’ll have to wait a few months to see if this change will have the positive impact we think it will have, and we’ll keep you updated on it in one of our future quarterly reports.
And That’s a Wrap!
And there’s the quarter!
It was an exciting quarter with a lot of changes to some of our oldest processes, such as exclusivity, listing fees, and verifying buyers’ proof of funds instead of a deposit process.
All of our changes always try to serve the goal of making it easier for you to do what you want to, whether it’s selling or buying a business. So far, we think we’re well on the path to making it even easier to do just that.
As always, we hope this report helps inspire you and your business to reach new heights.
We’d love to hear how your Q3 went and how your Q4 is looking. Feel free to leave a comment or just drop us a message; we’re always happy to chat.
The end of 2020 is near. The marketplace and industry as a whole is in a good position, and we think our industry is on the verge of blowing up in more mainstream investment channels in a big, big way.
In fact, we’re working on something right now that is going to help do just that. Of course, we can’t talk about it just yet, so we’ll leave you with a teasing cliffhanger for the next quarterly report when we can actually talk about it.
Here’s hoping your Q4, and 2020 in general, will be the best year yet for your business.
