Q1 2020 Quarterly Report—January, February, March
 Updated on January 24, 2025

It’s that time of the year again.
Every quarter, we put together this report as part of our commitment to transparency and, hopefully, to inspire you.
In Q1 of the new decade, we were faced with multiple challenges: challenges that you are likely also facing. You’ll see this reflected in our numbers, and we’ll discuss the setbacks more toward the end of this report. Despite the hits, we are still cautiously optimistic about what we can achieve in 2020, and we hope you are too, regardless of the challenges you’re facing.
While the economic climate is definitely grim, it is important to remember that those who survive hard times position themselves well to take advantage of all the gains coming out of those hard times.
If you’re a seller looking to sell, fear not. There are still buyers looking to buy.
If you’re looking to buy, you’ll be happy to hear that we saw the most seller submissions ever in Q1 of 2020, giving you a plethora of options for acquiring digital assets.
Let’s dive into the numbers and what went down in Q1 2020.
Executive Summary: Q1 2020 Report
Q1 2020 Business Data
Business Data
Total team members: 69
Founders: 2
Sales team members: 16
Marketing team members: 8
Operations team members: 30
Engineering team members: 8
Human resources team members: 1
Finance team members: 2
Contractors: 2
Email subscribers: 91,961
Podcast downloads: 103,797
Site visits: 336,269
Revenue
Brokered site sales: $7,397,676.70
Listing fees: $10,759.00
Additional/other revenue: $39.82
Average deal size: $139,578.81
Total revenue: $7,408,475.52
Earnings
Brokered site earnings: $1,083,714.71
Listing fees: $10,759.00
Additional revenue: $39.82
Total gross earnings: $1,094,513.53
Fourteen Seven-Figure Businesses for Sale Right Now
At the time of this writing, we have fourteen businesses above the coveted million-dollar mark for sale. Despite the current events in the world, this is the highest number of seven-figure deals we’ve ever had on the marketplace at one time. There may be even more of these deals on our marketplace in the coming months as business owners look to cash out on their digital assets by selling them.
Here’s a brief look at each deal. Feel free to click the links to get a more detailed overview of each.
- Listing #46740: A content business monetized through various affiliate programs and display advertising in the pet care niche. This business was created in May 2016. It is valued at $1,060,253.
- Listing #47823: An Amazon Associates and display advertising business in the culinary niche. This business was created in January 2018. It is valued at $1,050,377.
- Listing #47740: An advertising business in the culinary niche. The business was created in August 2013. It is valued at $3,629,716.
- Listing #44985: A Fulfilled by Amazon (FBA) business and wholesale e-commerce seller in the electronics niche. The business was created in August 2014. It is valued at $2,705,978.
- Listing #46352: An e-commerce and FBA business in the digital media niche. The business was created in March 2017 and is valued at $2,502,179.
- Listing #44575: An Amazon FBA business in the home niche. The business was created in March 2016. The business is valued at $1,906,939
- Listing #47581: A content business in the news and education niche monetized through info products, affiliates, display advertising, and subscriptions. The business was created in September 2014 and is valued at $1,846,923.
- Listing #46538: A SaaS company operating in the business niche. The business was created in January 2009. The SaaS company is valued at $1,516,974.
- Listing #47807: A business monetized through digital products and dropshipping in the health and fitness niche. The business was created in January 2019 and is currently valued at $1,458,829.
- Listing #47242: An Amazon and affiliate content business in the survival and security niche. The business was created in January 2017. It is currently valued at $1,364,899.
- Listing #47180: An Amazon KDP business in the romance niche. The business was created in January 2017. It is currently valued at $1,124,255.
- Listing #47639: A two-site package monetized through affiliate and Amazon Associates in the news and education niche. The business was created in May 2015. The business is currently valued at $1,114,805.
- Listing #47608: An advertising and AdSense business in the religion and spirituality niche. The business was created in March 2014. It is currently valued at $1,098,699.
- Listing #47101: An FBA business in the gifts and occasions niche. The business was created in December 2016. It is currently valued at $1,070,737.
Revenue Breakdown
Brokered Site Revenue
Here is a look at our overall marketplace sales:
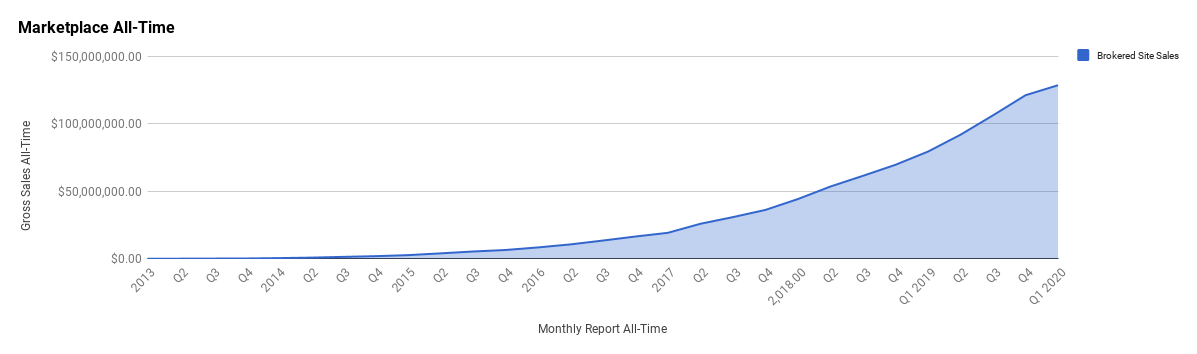
You can see our sales tapered off a bit last quarter. When you look at our sales quarter by quarter, the story becomes clearer.
Below is a breakdown of our revenue quarter by quarter:
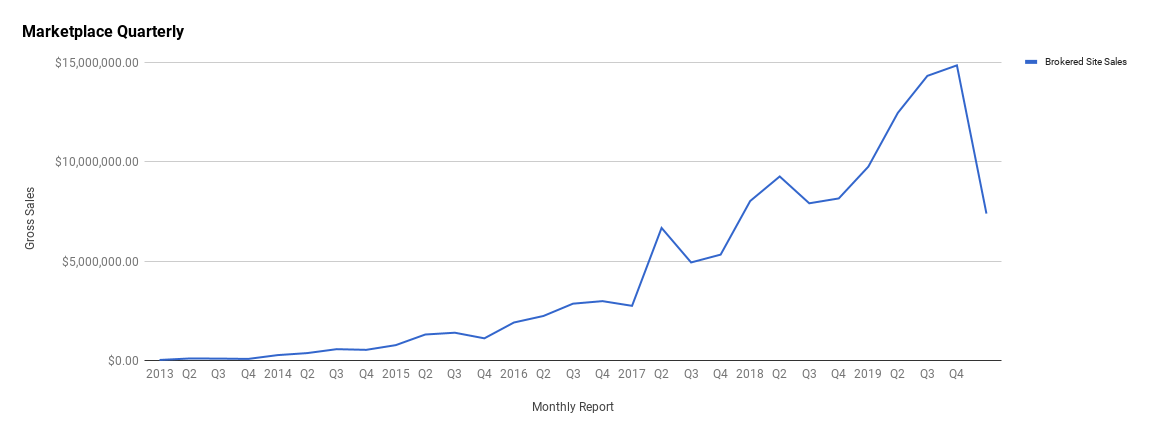
As you can see, our revenue dropped off steeply in Q1 2020. We earned $7,408,475.52 in revenue for Q1, which is a huge decline from Q4 2019, when we earned $14,882,278.35. The drop puts us back into Q3 2018 numbers, when we earned $7,930,476.42 in revenue. In 2018, the Q3 revenue was the lowest for the year, and it still outpaces what we earned in Q1 2020.
It remains to be seen if this trend will continue further in 2020. The Q3 dip in 2018 was a one-quarter instance, and Q1 2020 could very well be the same. However, we are facing challenges that are more complex in 2020.
An interesting data point in Q1 2020 is that we received the highest number of seller submissions in our company’s history with 477 businesses entering our vetting process. Q1 typically has the highest number of submissions, and this quarter was no different.
The main difference this quarter versus other quarters happened in terms of buyer confidence.
As the pandemic swept the world, and as many countries are still battling it, buyer confidence in the market has been shaken. Deals that were getting funded no longer were, and buyers were generally more conservative with their acquisitions amid the economic uncertainty.
We predict this lack of buyer confidence to continue at least into Q2. Many buyers are waiting to see what happens, and many of them are looking to pick up wounded businesses at a discounted price. Yet, with everyone staying home largely, internet traffic has shot up for many entrepreneurs leading to some of their most profitable months ever which means a large amount of businesses have not actually seen their valuations drop.
Buyers have also become more conservative and sharpened their negotiation skills to lower the sales prices of the businesses they acquire.
We sold 53 businesses in Q1 2020, which is not far from the 59 sold in Q4 2019, though it is far from Q3 2019’s 77 sold. The main difference between Q1 2020’s 53 sold and Q4 2019’s 59 is the businesses’ average sales price. In Q1 2020, our average deal size was $139,578.81 versus Q4 2019’s $252,133.44.
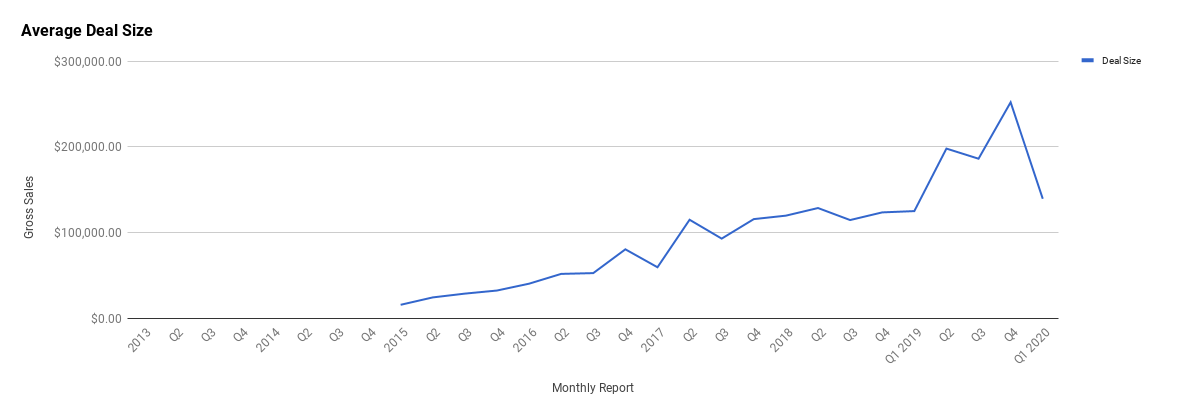
Until this quarter, our deal sizes were growing at a healthy pace. There is not much we can do about this in the face of a global pandemic, but we think the current trend will likely reverse, if not by next quarter, then by Q4 2020, when our average deal size will be comparable again with that of 2019.
The basis for this reasoning is that by Q4 2020, we will be in a “new normal.” While the economy is unlikely to have fully recovered by Q4, buyers will better understand the new market realities and will be able to make more informed decisions about their acquisitions. It’s the uncertainty about the future that’s holding back some buyers today.
We know that many larger institutional funds in this space are raising millions to acquire digital assets. They’re still in the game, now more than ever as they hunt for good deals, but are looking to find the right deals. Several have told us personally that they do not intend to stop their acquisitions in 2020. On the other hand, buyers in the sub $500k range will probably be more cautious in their buying decisions. Of course, we’ll have more data by the end of Q2.
Last year, we assumed 2020 would be a year of major growth for us. We now realize this is very unlikely to be the case. However, we have always believed our company is fairly well protected against recessions and downturns in the market. Considering the amount of revenue we earned in Q1 during a global pandemic, we stand by that statement.
The next couple quarters will test whether this statement continues to hold true. At the time of writing, though, Q2 is reaffirming our stance.
Because we missed our Q1 goal by a significant amount, we’ve readjusted our goals and budgets to 2019 levels and will likely continue to do so throughout 2020. We’ll be making quarter-to-quarter decisions regarding our goals until buyer confidence returns and we’ve settled into this “new normal”.
Business Listing Fees
When an entrepreneur decides to sell their business with us, they pay a one-time listing fee. This fee covers some of the cost of vetting the business to make sure it is a worthy asset for our buyer pool but, in reality, acts more as a filter of people who aren’t serious about selling their business.
We charge first-time sellers $297 and repeat sellers $97.
In Q1, $10,759.00 in listing fees were paid to us. This is up a bit from Q4 2019, when we took in only $6,334.00 in listing fees. While it is nice to have this money, it has never been significant to us, and we actually refund the listing fee if our vetting team considers a business unqualified. Considering that we reject more than 80% of businesses that currently submit to our marketplace, listing fees are unlikely to bring in a sizable amount of our revenue.
Those are the revenue numbers.
While we were hit hard in Q1, our team remains resilient in the current, uncertain market. We predict that more sellers will come to our marketplace to cash out on their businesses and hold money in reserve for the coming months, so our seller submissions should go up.
We won’t be able to compare Q1 submissions with those of Q2, however, as Q1 is always our biggest quarter for submissions. At the moment of writing, we’ve had 115 seller submissions in Q2, which is nearly on track with Q2 2019, when we had 363 for the entire quarter. This is good news and we’d expect economic trends to lead more sellers to us through 2020.
Let’s dive into how well our brand did in Q1 despite the global events.

Traffic and Audience
Blog Traffic and Analytics
Our blog remains one of our largest traffic generators. We started out as just a blog, which would eventually turn into the world’s largest curated marketplace.
Since our last quarterly report, we’ve been publishing more data-driven articles. If you’re a buyer or are interested in what happens to digital assets after they’re purchased, then check out the three research posts below:
Here is our traffic for Q1:

In Q1, our website had 336,269 sessions. This number is quite a bit lower than Q4 of last year, when we had 439,625. The reason for this is not entirely clear. The growing pandemic on everyone’s minds toward the end of Q1 partly explains it. This downward trend in sessions also stems partly from the fact that our customers may be skipping our normal website domain by logging directly into their marketplace account and thus not appearing in our normal site analytics. We don’t have enough users for this to fully explain the traffic drop, but it certainly played a part.
We did notice some drops in Google rankings, but nothing too significant. The drop in traffic didn’t translate to fewer sellers, as Q1 2020 remains the quarter with the highest number of seller submissions we’ve ever had.
In recent months, Google has been volatile with their updates, but we expect to soar back in the SERPs, like we weather most storms Google throws our way especially as, in 2020, we are making a concerted effort to increase our rankings with a few choice keywords.
Here are our top referral channels:
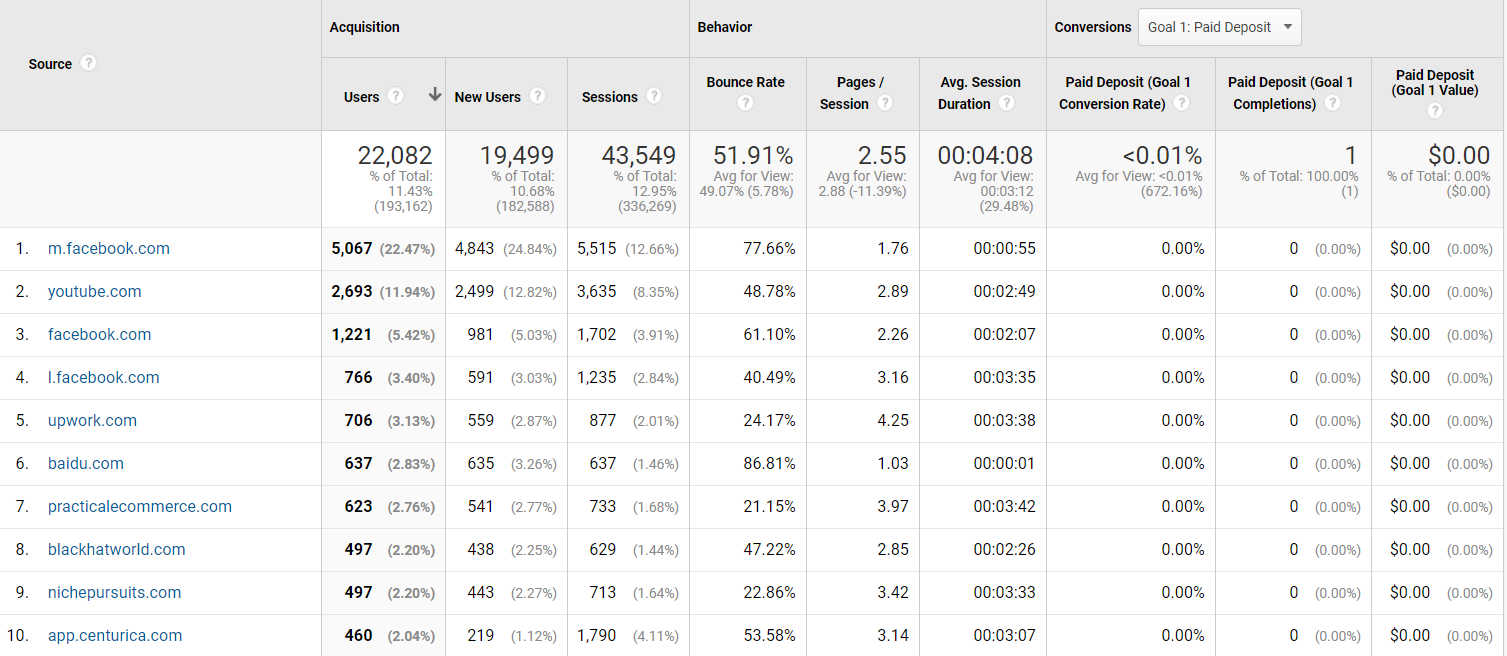
As you can see, Facebook is our largest source of referral traffic. This makes sense because we are fairly active in many digital entrepreneurship groups and often post new content to our Facebook page.
It is nice to see our YouTube traffic is doing well, as it has not been our focus. We are trying to produce educational videos, but that project is not yet up and running to our standards.
Upwork is a bit of a misnomer here as a qualified traffic referrer, as we recently used that platform to hire a video editor which led to this bump in traffic.
In total, our referral traffic led to an extra 19,499 unique users to our website, translating into 43,549 sessions. On average, our referral traffic spent 4:08 minutes browsing our website across an average of 2.55 pages.
These numbers are actually down from Q4, when we had 30,908 new users from referral traffic, This is easy to explain. In Q4, we were marketing several openings across various job boards, so three of our top referral channels were job seeker websites. One of our job posts went semi-viral across YouTube and got featured on a site, which sent a whopping 1,189 unique users looking to apply for the job to our website.
Let’s take a look at some of our most popular pages, according to analytics.
Here are our top three most viewed pages:
Here are our top three most viewed listings:
- Listing #44985: An FBA business in the electronics niche created in August 2014 and valued at $2,705,978.
- Listing #47137: (SOLD!) An FBA business in the bed and bath niche created in January 2016 and valued at $24,681.
- Listing #46830: An FBA business in the hobbies niche created in September 2015 and valued at $32,652.
Here are our top three most viewed pieces of content:
- How to Start an Amazon FBA Business
- The Most Popular Online Business Models
- The Lead Gen Business Model Explained
Here are our top three most viewed recent pieces of content:
- Our Data Driven Content ROI Study – What Happens After a Buyer Buys?
- A Data Driven Analysis of Six-Figure Affiliate Sites
- Building a $100 Million Amazon FBA Portfolio
Podcasts and Shows
Podcasts remain one of our most consistent and powerful content marketing channels. We host several shows under the umbrella of our brand, all appealing to different audiences—from your institutional investor down to the scrappy entrepreneur just starting out.
Let’s take a look at our Q1 numbers for these podcasts.
The Empire Flippers Show
The Empire Flippers Show, hosted by our co-founders Justin Cooke and Joe Magnotti, remains our flagship show. The show features high-level interviews, as well as deep dives featuring “inside baseball” on the buying and selling online business space.
We saw strong downloads in the first part of Q1, which then trailed off with little spikes as we published new episodes. We have recently begun publishing episodes more often, which should lead to more downloads overall.
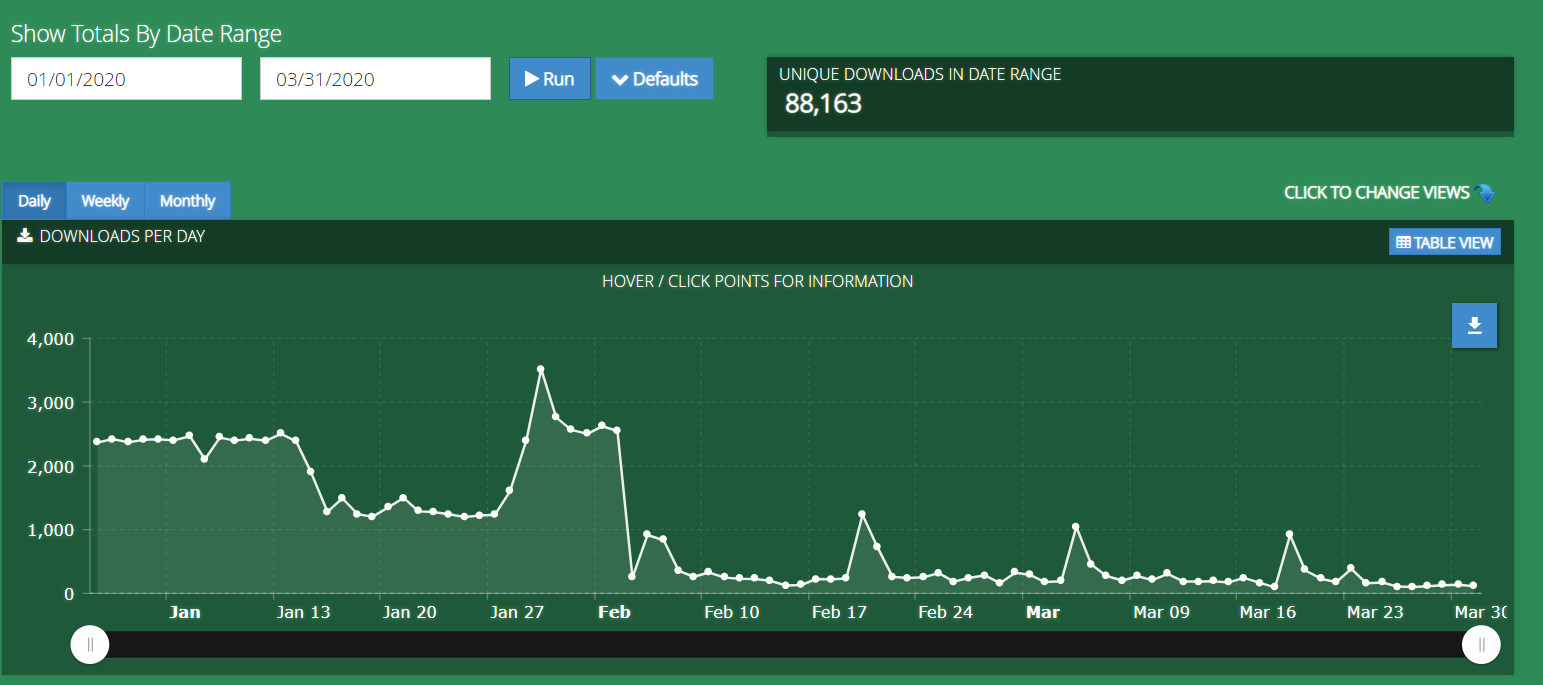
In Q1 we had 88,163 downloads, which is down from Q4, when we had 226,697 downloads. These numbers sound incredibly high, and they are, but there is some nuance here. For one thing, we had oddly high downloads out of France back in Q4 that is suspect and that may be heavily skewing the data. We looked through our analytics and couldn’t find exactly why this happened.
Another change that led to positive download growth is our new podcast page using the Libsyn player, which counts each listen on our website as a download. In addition to this change, we’ve also syndicated the podcast on several podcast apps, such as Spotify, which has seen solid growth as a podcast platform. Adding the podcast to Spotify alone led to an additional 663 downloads we would not have otherwise had.
You can see that the vast majority of our podcast listeners access the show from our website:

Here are our top three most listened to episodes for the quarter:
- EFP 193: Our 2020 Industry Predictions
- EFP 194: The Roofstock Marketplace
- EFP 196: Human Proof Designs
The Web Equity Show
The Web Equity Show is hyper-focused on the buying and selling of online businesses and is co-hosted by Justin Cooke and Ace Chapman. The show has been released in seasons for most of its history. Every season focuses on just one aspect of either buying or selling businesses. It remains one of the best sources of A to Z information about this industry.
Recently, we launched a version of the show in which Justin and Ace speak about current events and their effect on the digital asset class.
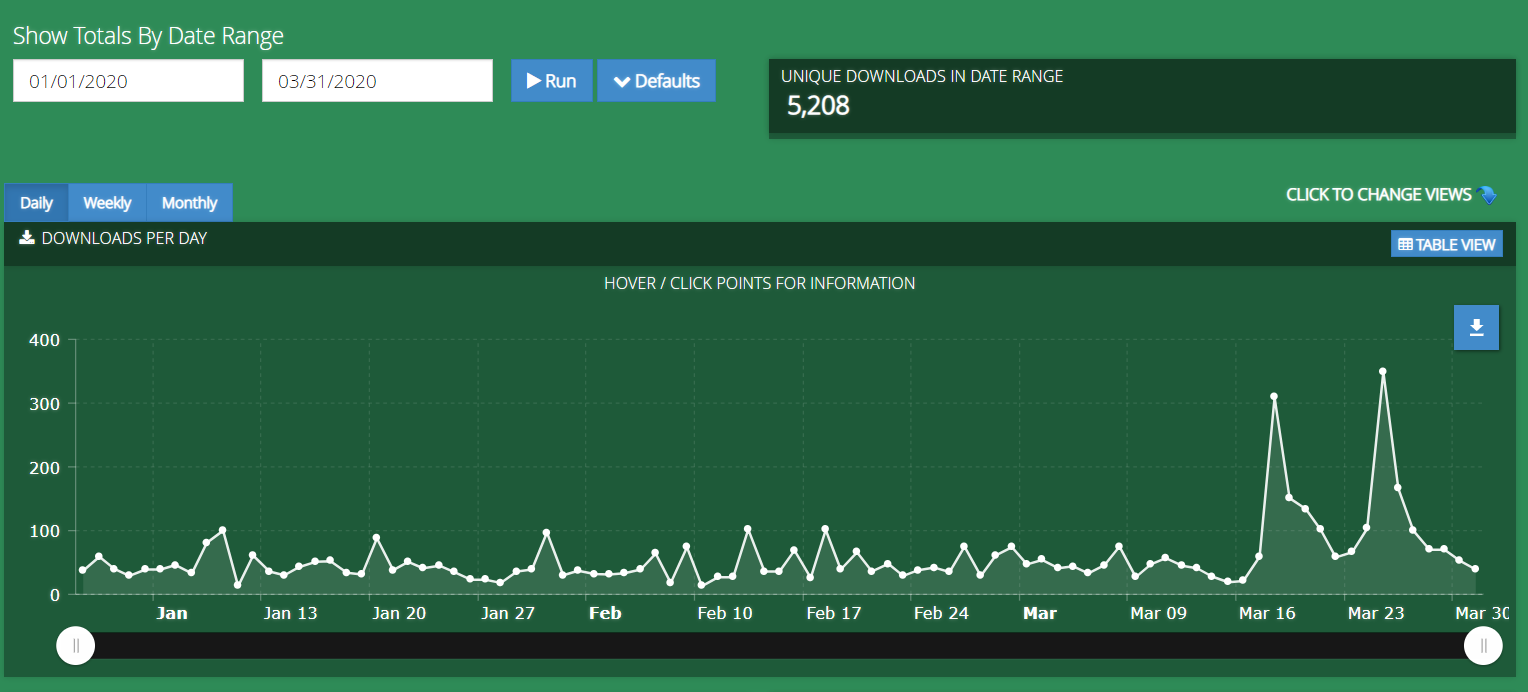
In Q1 we saw 5,208 downloads of this show, with the downloads picking up steam toward the end of the quarter as we published new episodes. Downloads are up by a healthy number over last quarter, when we had 4,320 downloads.
Publishing new episodes is a key performance indicator of a podcast show’s growth. We’ve published several Web Equity Shows in Q2, and as of May 4th, we’ve already reached 4,679 downloads for the quarter, putting us well on track for one of the highest download periods in a long time for the show.
Here are the top three most listened to Web Equity Shows in Q1:
Real Money Real Business (RMRB)
RMRB is a weekly podcast in which we interview owners who are selling their business on our marketplace. The best thing about these interviews is that they’re with real entrepreneurs who have built real businesses; we can say that with confidence, considering we’ve often helped them build out their profit and loss statements.
These interviews provide amazing insight into what makes a sellable business and into the entrepreneurs’ thoughts and strategies, and they serve as inspiration for any entrepreneur just starting their journey.
For people looking into acquiring businesses, episodes of RMRB are a great starting place. If you register for a free account on our marketplace, you’ll be able to filter ALL the businesses we have for sale that have an RMRB episode, which will be tagged in the “Seller Interview” filter. This makes it easy for you as an investor to see if the seller is someone you’d like to work with and to learn more about the business with minimal commitment.
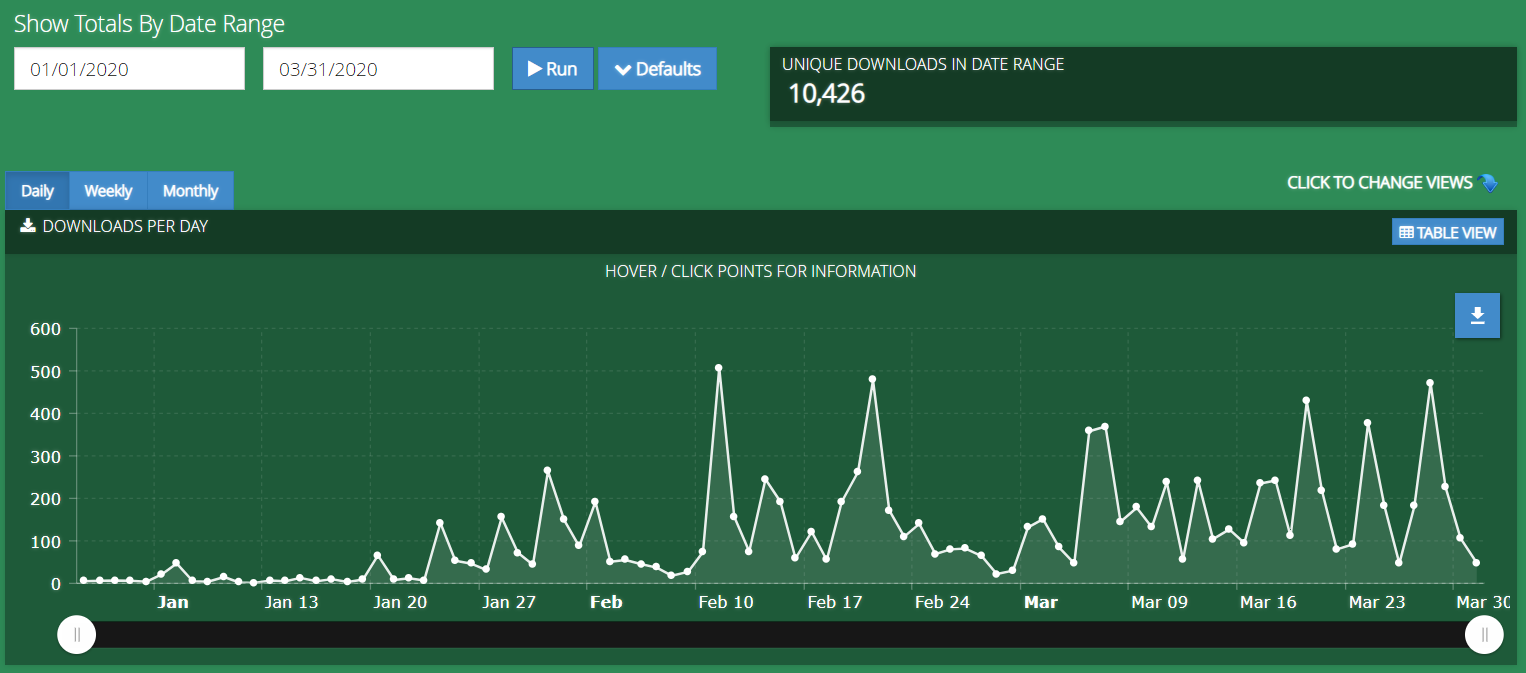
In Q1, this podcast had 10,426 downloads. That is a huge increase from Q4 2019, when it had only 1,253 downloads. That is an 817% increase in total downloads.
So what happened here?
Simple. Increased publishing and consistency using a small little pivot of how the show was produced. When we first started RMRB, we wanted it to be different from the seller interviews on our YouTube channel. Originally, we wanted to post only the best possible episodes of the podcast. This method was a bit of a failure.
Problems arose about how to decide what qualifies as a good fit for an episode of RMRB. Then, we may not have had an interview that met those standards for weeks, leading to publishing inconsistency. Plus, when we did publish episodes, they were usually about businesses that had already sold on our marketplace, making the podcast useful only for brand awareness, marketing-wise.
The pivot happened when we decided to rebrand all of our seller interviews on Youtube into RMRB episodes and to make every interview as close to RMRB quality as possible. This process change also meant that we published all interviews to the RMRB podcast, and it became fully integrated in our content distribution strategy. There were some growing pains on this front in terms of the system to organize the content and publish it correctly, but through the power of iteration, we’ve streamlined the process at this point.
Now, we publish anywhere from two to seven (sometimes more) episodes per week.
This small change has led to the 817% increase in downloads, grown our overall audience, and increased brand exposure, and now the episodes feature businesses that are still for sale on our marketplace, so potential buyers can listen to the episode, unlock the business, and purchase the asset.
Our top three most listened to episodes of RMRB are:
- RMRB 61 – Growing a Content Site in the Health Niche
- RMRB 56: Creating a Strong SaaS Business with Room to Grow
- RMRB 51: A 3-Site Amazon Associates Business in the Electronics Niche
Email and Contacts
Email marketing remains one of our most important traffic channels.
When you run a business that has many moving parts, email is a significant task. We are constantly looking at funnels, optimizing email sequences, and trying to lower unsubscribe rates while increasing open rates and CTRs. It is a complicated and sometimes convoluted process, one that we’ve been putting real sweat equity into simplifying.
When you have years of funnels built up, though, the data can be quite the tangled web, making it difficult to parse through to find what is important and what isn’t, what to tweak and what not to. The problem is compounded, as always, when you consider that we’re a double-sided marketplace, which means blanket lead scoring systems, like Hubspot provides, do not work well for us as we’re serving two very different customers: buyers and sellers.
Still, we’re pretty proud of the work we’ve done recently.
Here is how our email list grew in Q1:

In Q1, 5,980 new subscribers joined our email list through a variety of marketing initiatives, up from Q4 2019, when we had 5,402 new subscribers.
Here is how our list size growth looks over a three-year period:
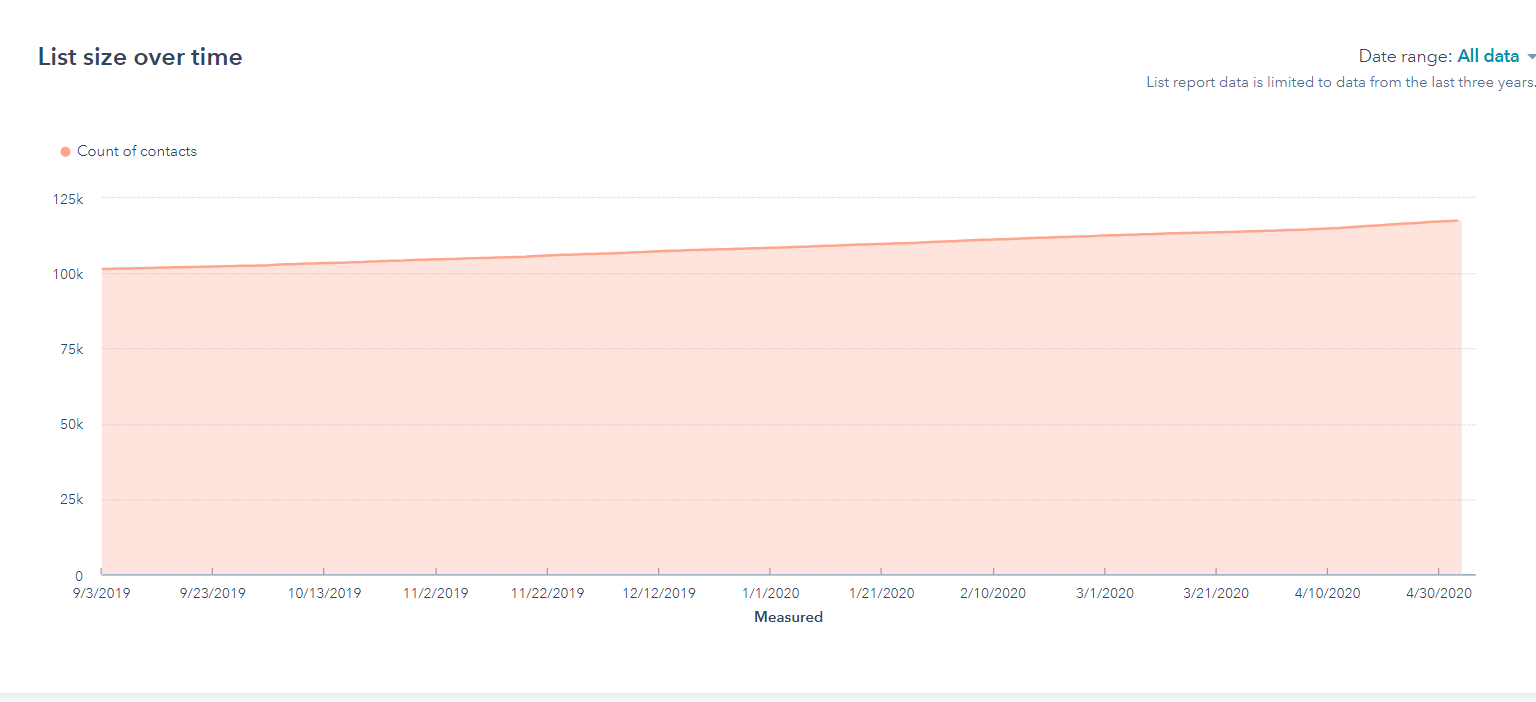
Hubspot recently made it possible to view only three years of data, but it shows a solid trend upwards. Our content marketing strategy has always been slow and steady, so it makes sense to see this style of growth.
The chart above represents 117,591 subscribers and leads in some form of lead-nurturing marketing funnel.
We’ve recently begun to look at where in our funnels our subscribers unsubscribe. This work is still in the starting phases, but a pleasant surprise has been that subscribers who fill out our valuation tool, or download our industry report tend to not only stay on our list but open our marketing automation emails at great open rates and click-through rates with minimal unsubscribes.
We’ll be able to report on these numbers more deeply next quarter, but the early signs point to solid success in retooling our funnels to be more relevant to our subscribers’ place in their customer journey.
Customer Experience
Customer experience remains one of our core focuses. Our operations team is constantly iterating on our systems to make the buying and selling process seamless for our customers. We are still using Zendesk as our main software to communicate with our customers, so let’s look at what our customers had to say about their experiences with us in Q1 2020 .
Customer Feedback
Here are a couple of screenshots of the kind of feedback we’re getting from our customers:

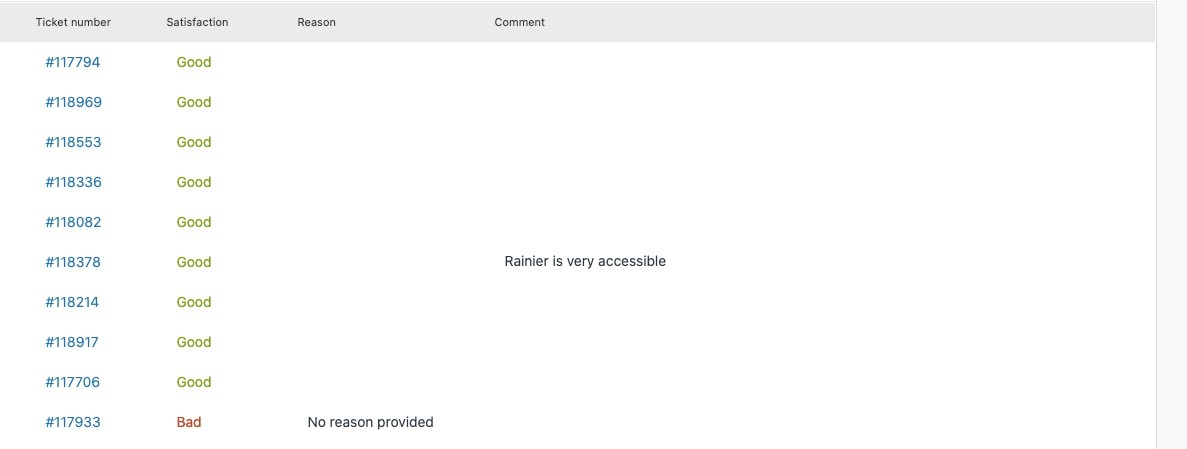
We have plenty of positive feedback on our team’s speed and reliability. It is always nice to hear that our customers feel our team is knowledgeable. In terms of negative feedback, we don’t have much to report because negative scores included little in the way of comments.
Most of our negative feedback is directed at our vetting department, when a seller is surprised we rejected their business. No seller likes to hear that their business doesn’t qualify for our marketplace, which sometimes leads to some sort of negative feedback for us.
Now that we’ve looked at how our brand fared in Q1, let’s dive deeper into the actual events of the quarter.
What Happened in Q1 of 2020?
Many things happened in Q1, from conferences to new white papers to launching a marketplace with better user experience, not to mention the pandemic still raging around the world, which picked up steam toward the end of Q1.
The New Industry Report

Our State of the Industry Report remained so popular throughout 2019 that it was still receiving praise toward the end of the year. It is such a success that it is now firmly implemented in most of our marketing funnels.
This is the single largest report in the entire industry to analyze deals bought and sold using their actual time on market and their real sales prices. It has since been used by our customers and even by other companies as a kind of almanac for our industry.
In 2020, we decided to make it even better.
In Q1, we launched a brand new State of the Industry Report that analyzed 700 different businesses bought and sold on our marketplace over a three-year timeline.
We added an entire section discussing earnouts, a piece that was missing from 2019’s report. Our tracking of earnouts has improved, which gave us data about them to work with. Now, you’ll be able to see the likelihood of an earnout for different types of businesses. We are tracking extra data around earnouts in 2020, so we can expand this section further in 2021.
If you haven’t downloaded our State of the Industry Report, click here to download it now.
It’s totally free, and we hope it provides you immense value, whether you want to acquire your next digital asset or to make a life changing exit by selling the one you’ve built.
White Label Expo

The White Label Expo was a huge success for us. Our director of sales, Alex Champagne, gave two speeches over the Expo’s two days.
The team manning our booth fielded questions from dozens of wildly successful FBA entrepreneurs.

The contacts we made here were invaluable. Events like this can be hit-or-miss in terms of their value, but this one was a major success.
The Sydney Online Marketing Conference
We were invited to speak at the Sydney Online Marketing Conference this year. It was a fantastic time, and I got to personally meet the people in Australia’s SEO scene. James Norquay put on a fantastic show, and we made some solid connections in addition to getting people excited about the potential of selling and buying digital assets.
ROI Studies—What Happens When a Buyer Buys?
An incredibly common question we get is . . . what happens to businesses after they’re purchased? Do they die off? Do they become wildly successful? Do the buyers ever make their money back?
It’s a fair question.
But it’s one that we’ve never really been able to answer. In the past, we could rely only on anecdotal evidence of buyers’ success with their acquisitions. We based that partially on stories buyers sent us but also on our high number of repeat buyers. We thought we were safe to assume that we wouldn’t have so many repeat buyers if acquiring digital assets wasn’t highly profitable.
Now, we know.
Toward the end of Q4 2019, we embarked on the project of calling all our buyers in specific business models to ask them data-driven questions. The buyers we talked to had to have owned the business for at least six months to qualify to be interviewed.
These studies aren’t perfect, as we got data only from those willing to take our calls. However, we do think these studies have painted a clearer picture of what happens to online businesses post acquisition.
So far, we have published two of these ROI studies, one about content businesses and one about FBA businesses. In both of these studies, a resoundingly positive percentage of buyers maintained, doubled or, in some cases, tripled the ROI for the businesses they acquired within fairly short timeframes.
In Q2 2020, we’re planning to publish our e-commerce ROI study. Eventually, we’ll be able to conduct a full monetization wide study using all of this compiled data from the buyers we’ve interviewed across all business models and we’ll likely add an entire buyer ROI study section to our industry report.
If you like to check out the ROI studies, click the links below:
Along with these two buyer studies, in which we actively interviewed our customers, we compiled a data-driven report on the ROI buyers can get by buying and flipping a business to sell at a profit. The numbers showed clearly that flipping online businesses can be as lucrative as we’ve always claimed.
Click here to read our flipping research.

Hiring Across Departments

We had planned for huge growth in 2020, so in Q1, we hired in every department. Our sales, marketing, operations, engineering, and finance departments all grew in Q1.
As most of the world struggles to adapt to the new normalities of a pandemic, our initial plan has been subverted. Still, our new hires are quality team members, and we always plan for it to take several months before a new hire is up to speed and able to add great value to the organization.
The pandemic has posed new challenges in this regard, but our company was built with many of these challenges in mind. While many companies struggle to go remote, we have and always will be a remote organization. As other companies attempt to adopt online collaboration tools, we’ve been using and optimizing them for years.
Q1 was our first hiring round of the year, and some departments had planned for another hiring round toward the end of 2020. Now, we will wait and see how the pandemic unfolds before committing to another round.
While we are not currently hiring, please check our careers board for opportunities to work with us as they come open.
Website Redesign and the New Marketplace
Our marketing and engineering team have been working around the clock to roll out a new, modern look for Empire Flippers. The marketing and engineering departments combined heads to create a more dynamic look, which we launched slightly after Q1, but which we worked on throughout early 2020 and a little before.
The redesign focused mainly on our marketplace. Over the years, our business has evolved from a blog that happened to have a marketplace to a marketplace of online businesses that happens to have a blog.
We’ve also included an entire page in our blog dedicated to explaining how the buying and selling process works, along with individual articles that explore different processes in greater depth.
Our public-facing marketplace now looks much more like it does when you register for a free account. You’ll notice that many features of this redesign are “locked”. You can easily unlock these features by making an account or signing into your current account. Plus, you’ll get access to a ton of other new features that can significantly speed up your due diligence process when you look for profitable acquisitions.
If you’re a seller, this new marketplace means more buyers will find your business than ever before. Even better, since they’ll be able to filter for businesses that meet their criteria, you’ll deal with buyers with far greater intent to purchase your business. The marketplace was designed to help buyers, which also makes it easier for you to sell your online business.
How did our new design and marketplace work out for us?
Well, at the time of writing at the end of April 2020, over 3,000 new user accounts have registered on our marketplace, so we can say the redesign is on the right track.
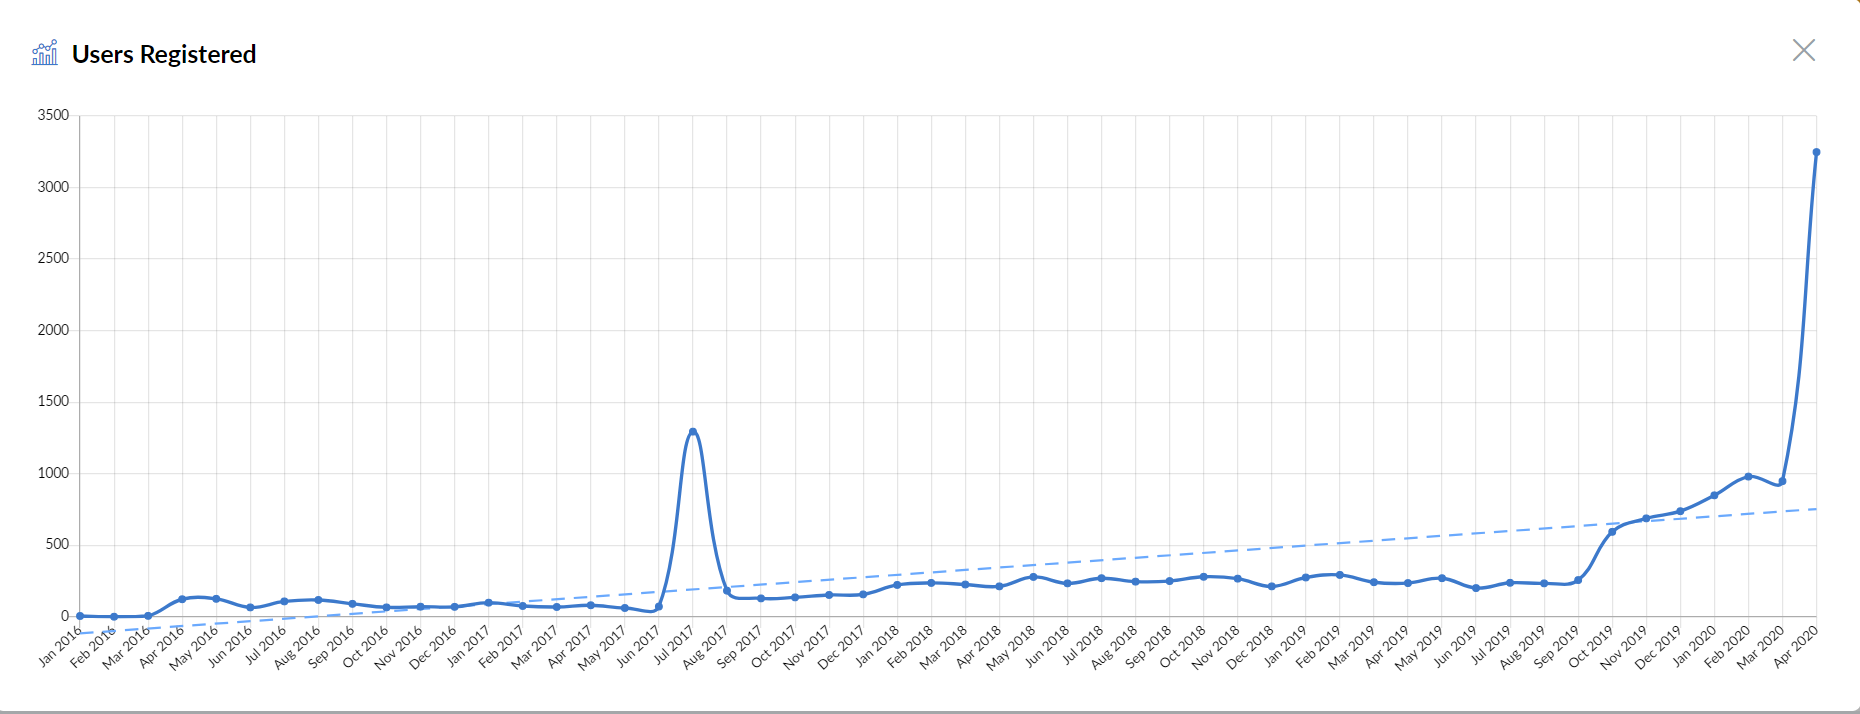
In the chart above, the first spike indicates the initial launch of our new marketplace for those who registered accounts. At that time period the new marketplace could only be seen if you were logged in. During that time we were mainly testing, tweaking and improving as users signed in.
In 2019 we were focused on improving the marketplace for users, which has paid off greatly with these Q1 design rollouts that has led to the spike in user registrations, a primary focus for 2020.
A Major Guide to SaaS Valuations

If you are a longtime blog reader or podcast listener, you’ve probably noticed there is one type of online business rarely on our marketplace: SaaS. The SaaS business model is attractive to both sellers and buyers, yet we’ve never made any significant marketing push to attract these businesses.
We’ve become the largest curated marketplace for e-commerce businesses for sale in the world, not to mention online businesses in general, but SaaS businesses remain a very small proportion of our marketplace.
In 2020, we decided to take a much more conscious, focused approach to attracting SaaS businesses to our marketplace.
We’ve always been built on content marketing, so it made sense we chose to go down this path first and foremost. In Q1 we researched and published our mega guide to SaaS company valuations, which you can read here.
We looked into the differences between MRR vs ARR, the most important metrics, and explained the CAC/LTV golden ratio for a healthy SaaS business.
In addition to this mega blog post, we updated our valuation tool to take the unique nature of SaaS businesses into account. SaaS operates differently from other businesses in terms of their valuation and what makes them attractive to investors, which means our valuation tool sorely needed updating to give SaaS business owners more realistic expectations about what they could earn by selling their software.
If you’re a SaaS founder and want to see what your company is worth, just fill out a few details about your company here for an automated valuation price range, free of charge.
Allowing Users to Chat in Real Time with Us
One of the features we launched in Q1 (something you can keep track of with our changelog here), is live chat. Right now, live chat is available only when you sign up for your free marketplace account and verify your identity. Some of our hires in the operations department are dedicated chat specialists whose mission is to make buyers’ and sellers’ lives much easier.
The chat function is still a pretty new feature, and while we have bigger plans for it, we are still in the testing phase. If you haven’t tried it out, register for a free account and send us a question or just say hello 🙂
The New Unlock Process to See Businesses for Sale
Between the relaunch of the website and the marketplace, we have also reimagined how our buyers can access the businesses we have for sale. In the past, we had a deposit process and a VIP process for verified buyers.
We have now switched to a new unlock process, which allows you to begin due diligence by showing your proof of funds. The new unlock process should speed up the buying process by streamlining your due diligence.
You can read about our new unlock process here.
The Pandemic—Supply Chain Disruption, Amazon’s No Non-Essentials, and Amazon Making Affiliates Even Less Essential
Now, onto a far less fun topic.
The pandemic is still raging around the world at the time of writing. It first affected our business in a major way in March. The worldwide pandemic was a large reason we didn’t meet our goals and continues to negatively impact our business today.
The pandemic hit us on three different fronts in Q1. The first major pain happened with the disruption of supply chains based in China.
Many entrepreneurs who had too little stock on hand were affected by this. Luckily, many other entrepreneurs had wisely stocked up for the long haul as the Chinese New Year traditionally leads e-commerce entrepreneurs to over-order stock in preparation for factories to be shut down for the holidays.
The next blow was Amazon’s new policy that they would be processing only essential goods in their warehouses. This policy affected many FBA entrepreneurs who had too little stock on hand and, now, no way to get more into the warehouses.
Finally, Amazon gave us another punch when they lowered their Amazon affiliate commission structure even further.
Many affiliates saw their earnings drop by a significant proportion. However, many of these affiliates saw such a huge increase in traffic, so the actual fall in profit was minimal for some sites. A great portion of that increased traffic comes from people locked down at home, many of whom are ordering products online for the first time.
We have always advised e-commerce entrepreneurs to have multiple suppliers, ideally in different geographical areas.
Even if some suppliers are just supplementary, they can be a saving grace in times like these. In addition, what happened in Q1 should be a reminder of the dangers of poor inventory forecasting and leaving your warehouses with too little stock.
We’ve preached for a long time that Amazon affiliates, in particular, should look to diversify with private affiliate programs, other affiliate networks, or other forms of monetization, such as display ads.
The affiliates who heeded our advice and thought in the long term came out of this situation just fine. Many of those affiliates right now are becoming business buyers for the first time, as they look for discounted Amazon sites for sale, so they can replace the Amazon links with higher-paying offers.
None of these punches between supply disruption, Amazon’s essential-only policies, and the Amazon Associate pay cut felt great for us on the marketplace, nor for the entrepreneurs that got affected by them..
Yet, as I’ve mentioned, we’re resilient against them.
We wrote about the possible effects of the pandemic not too long ago in our predictions of what may happen going forward here. Most of what we said holds true, and the world looms closer to an inevitable recession. It is important to remember that the world has always loomed closer to a recession. Recessions, booms, and even depressions are part of a cycle, and they come and go. Sometimes they are caused by financial markets, other times by events like the coronavirus.
Just because they’re part of the cycle doesn’t mean they don’t hurt when they happen, though. A more stoic approach will see you through these troubling times and may even set you and your business up for success in the long run.
We’re working on a blog post that shows how wealth is created in recessions, so keep an eye out for that as it may become more relevant with where we’re going with this economy.
I also personally gave a speech about entrepreneurship during recessions for the Survive and Thrive virtual summit recently. I’ve uploaded the slidedeck into a SlideShare embedded below:
Remember, the future will be the same as the present in many ways as history tends to repeat.
There is always a mixture of opportunity and challenges. Sometimes there are more challenges than opportunities, and sometimes the reverse. No matter the mixture, both always exist in some proportion.
It is up to you to find and leverage opportunities to make your business more successful than ever before.
Instead of fearing the future, ask yourself how you can improve yourself right now? Companies that grow and adapt in recessions are often the next boom’s darlings, after all.
Will yours be one of them?
What’s Next?
That’s it for our quarterly report.
A lot went down, and the future remains uncertain. One thing we can be certain of: the economy come back strong in the future. Not all businesses will make it through, but those that do will be in an excellent position to capitalize on the period of heavy growth that follows.
We’re still here to help your own personal economy roar if you decide now is the time for you to buy an online business for sale or if you’re ready to make a life-changing exit.
As always, we look forward to helping you in your journey.

Discussion
This is the most impressive update yet – can’t believe how much you shipped in Q1 with the new marketplace and content, and your list building is crazy good.
Thanks Richard 🙂
It was a crazy quarter, and Q2 so far is shaping up to be as well… but in a better way haha.
The industry is for sure still going strong!