Q1 Report: January, February, March
 Updated on January 24, 2025

Q1 of 2021 came and went in a flash.
Typically, the first quarter of the year is when we see the largest number of sellers deciding to list on our marketplace. They’re riding off the highs of the holidays and want to cash in by exiting a business making all-time high profits.
Well, Q1 did not disappoint in that regard.
Not only was 2020 the best year on record for our M&A brokerage, but Q1 2021 was our best quarter ever.
The market has continued to heat up with plenty of buyers hungry for acquisitions and a stampede of sellers wanting to get a life-changing exit for the brands they’ve built.
There was a lot that went down in Q1, so let’s dive into it.
Executive Summary: Q1 2021 Report
Q1 2021 Business Data
Business Data
Total team members: 71
-
- Founders: 2
- Sales team members: 18
- Marketing team members: 8
- Operations team members: 27
- Engineering team members: 10
- Human resources team members: 2
- Finance team members: 2
- Contractors: 2
Email subscribers: 118,167
Podcast downloads: 73,141
Site visits: 278,543
Revenue:
Brokered site sales: $47,339,600.11
Additional/other revenue: $31.12
Average deal size: $544,133.33
Total revenue: $47,339,631.23
Earnings:
Brokered site earnings: $3,176,690.52
Earn out payments: $142,088.47
Additional revenue: $31.12
Total gross earnings: $3,318,810.11
29 Seven-Figure Businesses for Sale Right Now
Over the last year or so, we have consistently outperformed the rest of the industry in terms of the sheer quantity of seven-figure businesses listed for sale on our marketplace. As you can see based on the large list below, that doesn’t look like it will change anytime soon.
In fact, we’ve passed the seven-figure threshold by selling our first eight-figure businesses in Q1—but more on that later.
If you are in the market for a seven-figure digital business, look no further.
Here are all the current seven-figure businesses we have for sale:
- Listing #50045: An Amazon FBA business created in December 2004 in the food and beverage niche. In addition to its long history, the business also boasts 694 SKUs and has become part of Amazon’s Top 100 UK brands. This business is valued at $7,204,383.
- Listing #50641: An Amazon FBA business created in May 2019 in the supplements niche. The business features 12 different SKUs that have thousands of 4 and 4.5 star reviews. This FBA business is also part of Amazon’s Brand Registry 2.0. This business is valued at $6,781,913.
- Listing #48704: An affiliate business four-site package created in July 2017 in the legal niche. The websites utilize four different affiliate programs, giving it a diversity of revenue streams. It has also seen strong year-on-year growth in both traffic and revenue. This business is valued at $5,958,829.
- Listing #51900: A dropshipping store created in July 2017 in the outdoor and home niche. The store sells big-ticket items and features informational how-to guides as part of its content marketing strategy. This business is valued at $4,573,740.
- Listing #49364: An ecommerce store created in January 2017 in the apparel and accessories niche. The business sells over 1,200 SKUs all relating to health. Weekly email campaigns are sent to a 120,000-subscriber list and there are two VAs handling customer service. This business is valued at $4,492,662.
- Listing #51641: An Amazon FBA and ecommerce store created in February 2014 in the apparel, accessories, and supplements niche. The business earns 95% of its earnings from Amazon with 5% coming from a Shopify store. This business is valued at $4,197,744.
- Listing #49202: An Amazon FBA and ecommerce store created in May 2014 in the beauty niche. The business includes two Shopify store fronts and an Amazon Seller Central Account featuring three SKUs and an email list with 10,000 subscribers. The products feature a trademark and are part of Amazon Brand Registry 2.0. This business is valued at $4,008,241.
- Listing #51430: An Amazon FBA and ecommerce store created in August 2009 in the home niche. The ecommerce store features 362 SKUs and sells across a variety of marketplaces from Amazon, Walmart, a self-hosted Shopify store, and eBay. The Amazon FBA portion makes up 78% of revenue with the ecommerce store making up 22%. This business is valued at $3,620,541.
- Listing #50455: An affiliate site created in November 2014 in the technology niche. Included with the website are 37 other domains in 19 different languages featuring news, reviews, and buying guides for a variety of gadgets. This business is valued at $2,745,727.
- Listing #51831: An affiliate and display advertising website created in February 2017 in the dating niche. The content business writes about spirituality, relationships, and personal health. It also has a built-in audience with 56,000 email subscribers. Slightly over 61% of its income comes from affiliate revenue, 32% from display ads, and 5% from ebooks. This business is valued at $2,719,207.
- Listing #50439: A dropshipping business created in January 2012 in the food and beverage niche. The store features a blog used for content marketing that drives traffic as well as produces revenue from display advertising. This business is valued at $2,683,247.
- Listing #52741: An Amazon FBA and ecommerce store created in August 2019 in the health and fitness niche. The business features three SKUs of recovery products for athletes. The products are uniquely positioned in the market with majority 4.5 star reviews, and the products themselves have a trademark. This business is valued at $2,468,445.
- Listing #51547: An affiliate, KDP, and info product business created in November 2014 in the outdoors niche. The brand has an email list of 35,000 subscribers, a strong social media following, and four well-reviewed books published via the KDP program. The business is valued at $2,453,284.
- Listing #50232: A display advertising and affiliate business created in July 2017 in the lifestyle niche. The business shows strong year-on-year growth with an ability to weather Google algorithm updates. The actual SEO traffic is well diversified across the site with the top three most trafficked pages making up less than 5% of total website traffic. This business is valued at $2,301,725.
- Listing #51935: A SaaS business created in October 2015 in the sports niche. The business features a YouTube channel with over 24,000 subscribers, an email list with 100,000 subscribers, and a strong brand. This business is valued at $2,276,422.
- Listing #49133: An Amazon FBA and ecommerce store created in December 2009 in the beauty niche. The business sells 40 different skincare products and also sells through the Amazon Rewards program. The ecommerce store offers subscriptions for specific products. Included in the sale are two trademarked brands and an email list with over 15,000 subscribers. This business is valued at $2,019,135.
- Listing #51592: A two-site package of ecommerce stores created in June 2009 in the pet care niche. The Magento store features 25 high-quality animal shelter products and has seen strong year-over-year growth. The stores also have an email list boasting over 25,000 subscribers. This business is valued at $1,961,932
- Listing #48901: A subscription and dropshipping business created in January 2018 in the art niche. Approximately 85% of revenue comes from subscription box sales. The business features an email list of 42,000 subscribers, five Facebook groups with the largest being over 17,000 people, and a Facebook messenger bot that has 14,000 subscribers. This business is valued at $1,745,554.
- Listing #48575: An Amazon FBA and ecommerce store created in May 2015 in the outdoors niche. The business features 36 SKUs that have received hundreds of positive reviews. In addition, there is an email list with over 30,000 subscribers. Amazon FBA represents 85% of revenue and Shopify the remaining 15%. This business is valued at $1,728,060.
- Listing #47601: An Amazon FBA and ecommerce store created in September 2018 in the equipment niche. The business sells a range of outdoor equipment with 564 different SKUs. Revenue is diversified across multiple platforms with Amazon making up 60%, eBay 30%, and Shopify 10%. The business has begun taking larger orders from the US and other governments. This business is valued at $1,256,572.
- Listing #52633: An Amazon FBA business created in September 2015 in the home and office niche. The business features 76 SKUs with 47 being sold on the US marketplace and 29 on the EU marketplace. The products have trademarks both in the US and EU. This business is valued at $1,249,137.
- Listing #48371: A productized service business created in November 2014 in the SEO niche. The business has built a strong demand in its B2B niche and has a custom-built order management system that removes several bottlenecks typically associated with service businesses. This business is valued at $1,237,950.
- Listing #50885: A digital products business created in September 2016 in the business niche. The award-winning digital product is considered an industry leader for the niche with an average of 4.8 stars out of over 2,000 reviews. This business is valued at $1,219,736.
- Listing #50297: A display advertising, affiliate, and dropshipping business created in October 2016 in the outdoors niche. The vast majority of traffic comes from organic search by utilizing educational guides and other informational articles. This business is valued at $1,142,379.
- Listing #48259: An eCommerce store created in June 2019 in the pet care niche. The business features 87 SKUs and the store itself is a trademarked brand. The brand has close to 1,000,000 followers on social media and an email list with over 350,000 subscribers. This business is valued at $1,135,500.
- Listing #50681: An affiliate site created in May 2017 in the home niche. The website has diversified its revenue across several different affiliate programs and organic traffic has been diversified across the website. All content creation is completely outsourced. This business is valued at $1,124,476.
- Listing #48344: An Amazon FBA and ecommerce store created in January 2015 in the home and kitchen niche. The trademarked business has 209 SKUs with very high average ratings across hundreds of reviews. This business is valued at $1,118,751.
- Listing #50184: An ecommerce, dropshipping, and affiliate business created in April 2018 in the apparel and accessories niche. Included with the sale is an email list with over 200,000 subscribers, a Facebook account with 42,000 likes, and an SMS marketing account with 40,000 subscribers. This business is valued at $1,004,521.
- Listing #51180: An Amazon FBA business created in August 2016 in the home niche. The trademarked business sells 79 SKUs related to home design and is registered with Amazon Brand Registry 2.0. The products are sold on both the US and Canadian marketplaces. This business is valued at $1,001,799.
Now that you see all the big listings for sale on our marketplace, let’s break down what we actually earned in Q1 2021.
Revenue Breakdown
Brokered Site Revenue
In Q1 2021, we generated $47,339,631.23 in gross revenue. That is a sizable increase from Q4 2020, when we generated $44,586,764.21. Both of these quarters show an absolutely gargantuan increase from Q3 2020, when we generated just $13,879,992.00 in revenue.
If you look at these three numbers you might think we were hurting in Q3 2020. The truth is, we were doing amazingly well at those numbers. This means that the hypergrowth the last two quarters have shown has made dramatic positive impacts on our company.
Keep in mind the above numbers are revenue, of course. As an M&A advisor, we take home only a small commission of what we sell, and the lion’s share goes to the actual seller. Our gross earnings in Q1 2021 sat at $3,318,810.11, which was a significant increase from Q4 2020, when our earnings were $2,508,229.80. Our earnings in Q1 2021 were almost double those in Q3 2020, when we earned $1,595,262.85.
The amount of demand for our services both by buyers and sellers have scaled drastically. This has led to our aggressively hiring again to catch up with this increase in demand.
Q1 2021 was the best quarter on record in the company’s history. So far, Q2 2021 looks like it might be beating Q1.
Let’s look at the numbers.
Below is a breakdown of our quarter-by-quarter growth:

You can see the painful Q1 2020 quite clearly in this graph, followed by our rise to newer heights throughout the rest of 2020. Then there was Q4 2020 that shot us to the moon, with Q1 growing further albeit in a more stable fashion.
It remains to be seen if this will continue, but we are fairly confident that it will for a time. Never has there been more interest in the M&A profitable digital asset space than today. Between high-net worth investors, family offices, private equity, and brand aggregators, there has never been more diversity in buyers acquiring businesses.
Here’s a look at our overall marketplace sales:
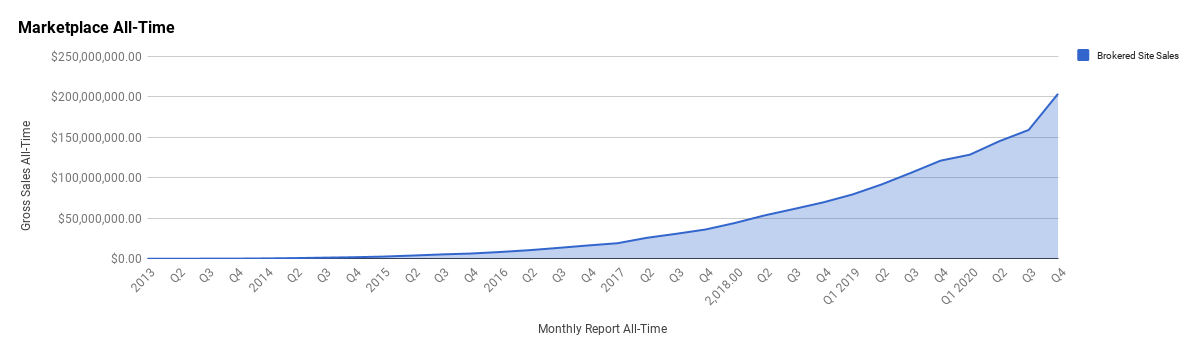 You could see the pains of Q1 2020 in the previous graph, which is why I like to show our cumulative graph right after. Many entrepreneurs experienced a lot of pain in 2020 and it can be incredibly disheartening looking at a quarter-by-quarter chart of your revenues when such a dip happens.
However, if you keep going and working hard on your business, you’ll eventually see a cumulative graph similar to ours. When you factor in everything you’ve done, the dips are not even obvious when you consider how much your brand has grown.
The same is very much true for us here, with the worst quarter in our history barely even noticeable.
Here is how our average deal size has changed over time on the marketplace:
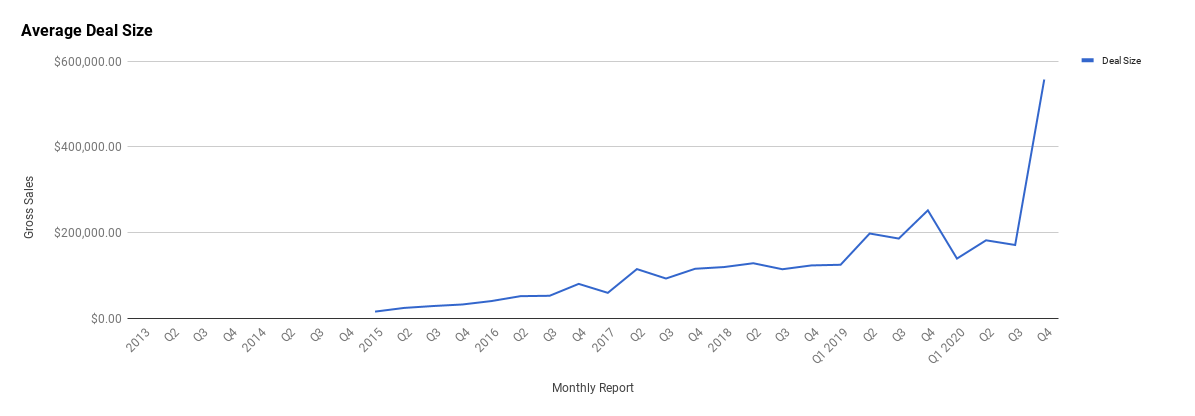
Our average deal size has skyrocketed over the last two quarters.
In Q1 2021, the average deal size sold on our marketplace was $544,133.33, which is slightly lower than Q4 2020 when our average deal size was $557,338.03. Again, both of these quarters absolutely shattered previous quarters in average deal size.
In Q3 2020, our average deal size was just $171,340.55 and our previous all-time high average was $198,109.30 in Q2 2019.
These are huge gains and a testament to how much our marketplace has grown. A big part of this increase in our average deal size is our first few eight-figure deals. In addition, we currently have more seven-figure businesses for sale on our marketplace than anyone else in the industry.
All of these successes led to a vastly improved average deal size.
While it is unlikely the average deal size will shoot up dramatically again in the short term, we do think overall that this is just the start of where we can go and what we can do. Over the long term, this number will continue to rise as we sell bigger and bigger businesses.
Alright, that’s enough talk about hockey stick graphs. Let’s talk a bit about what happened outside of revenue and earnings.
Let’s look at our various traffic machines.
Traffic and Audience
Blog Traffic and Analytics
Our blog remains one of our main marketing channels. We house almost all of our content marketing plans around our blog and each blog post can serve multiple functions from the top of the funnel all the way down to the bottom.
In Q1 2021 we focused heavily on SEO-focused content pieces. Mainly, these were shoulder pieces. A shoulder piece is content that is in the ballpark area of your primary niche but is not talking exactly about what you do.
An example would be a post on how to register for Amazon Brand Registry 2.0. We know anyone searching this out is an FBA entrepreneur or looking to become one. Our hope is to rank highly in Google searches related to these keywords and then direct that traffic into one of our many nurturing funnels.
So how did we do?
Here’s our traffic for Q1:
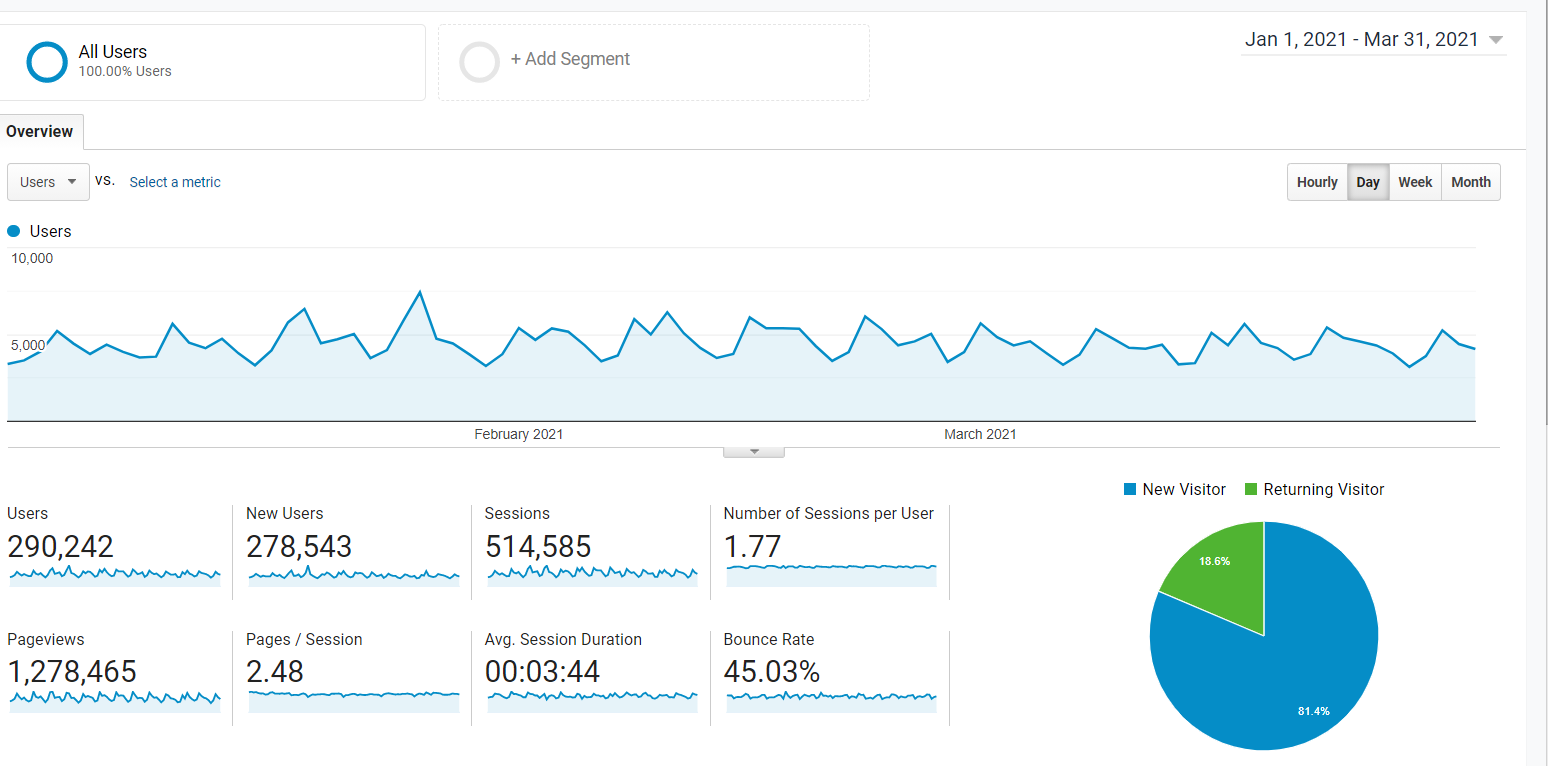
Here’s how that traffic compares to Q4 2020:

As you can see, we have some solid positive growth considering the size of our traffic. In Q1 2021 we had 278,543 new users, which represents a 12.58% increase compared to Q4 2020. In addition to the increase in new visitors, we also saw a sizable general increase of 15.44% in the number of visitor sessions on our website.
While pageviews, pages per session, and bounce rate all went down, respectively, our average session duration actually went up slightly, by 2.21%.
The decrease in pageviews is likely not as concerning as that 25.06% decline appears on the surface. The majority of this traffic is registering for a free Empire Flippers account, which means they wouldn’t be picked up as viewing more pages once they log in.
A less positive note here is that you could look at these graphs and say that our shoulder-niche SEO strategy worked wonders for us, but in truth, it didn’t live up to our hopes at all. The vast majority of the SEO-focused content we produced led to larger amounts of traffic, but did little to drive other marketing KPIs like leads, marketing qualified leads (MQLs), and opportunities for our sales team.
Granted, there is a solid chance that because this traffic is much earlier in the sales cycle, it will be potentially 6–10 months before anyone who joined our email list will become a customer. Our long sales cycle makes it incredibly difficult and convoluted to track anything reliably on the marketing side.
We’re still believers in SEO, obviously, as it is our main marketing channel to entrepreneurs who want to sell their businesses or investors who want to buy a business. However, after this experiment we’ve decided to scale down the shoulder-niche content to focus more on high-value data studies and other content that dives deep into a variety of M&A topics.
Here are our top referring channels:
 Facebook remains one of our top referrers, which makes sense considering the plethora of private groups and communities on the platform discussing investing and exiting profitable digital assets. We have also started putting out new job posts for rounds of hiring, which often leads to one job board or another going semi-viral, sending job applicant traffic to us like we see here with We Work Remotely.
It is interesting to note that Quora is our #7 top referral source and still produces results for us months after we scaled down answering questions in a proactive way. We still do answer questions from time to time, but we no longer make a concerted effort.
A deeper look at Quora shows some interesting data:

As you can see, the majority of top-level metrics such as users, new users, and sessions were all down in Q1 2021 compared to Q4 2020. The most important consideration is that all the KPI goals were far higher in Q1.
Quora passively achieved 43 goal completions for us in Q1, with three of those being seller submissions. In the grand scheme of things, this is a small number for us. However, it does go to show how a committed content marketing strategy can produce results long after the actual work for that strategy is completed. All the traffic and goal completions we had in Q1 and Q4 from Quora were generated completely passively while we focused on building up our content machine in other areas.
Here are our top three most viewed pages:
Here are our top three most viewed listings:
- Listing #4792 (SOLD!): An Amazon FBA business created in December 2016 in the home niche. The business is valued at $10,303,887.
- Listing #48704: A four-site affiliate package created in July 2017 in the legal niche, this business package is valued at $5,958,829.
- Listing #49022 (SOLD!): An Amazon Associate created in July 2019 in the automotive niche, this business is valued at $39,074.
Here are our top three most viewed pieces of content:
Here are our top three most viewed recent pieces of content:
- How SaaS Valuations Work: Multiples, Metrics and MRR
- The Income Store Scam: An Inside Look and What Happens Now
- How to Make $50K, $100K, or $500K Online
Educational YouTube Channel
Our educational YouTube channel continues to grow at a slow pace.
The YouTube channel focuses on a variety of M&A, online entrepreneurship, marketing, and data-focused videos for our audience. The niche for online business M&A subjects is of course quite small. We had higher hopes in Q1 for this channel, so what went wrong?
 In Q1 2021 we generated 25,478 views to the channel. Not a terrible amount by any stretch, but far fewer than we had hoped. Currently, we are still below the 1,000 subscribers goal we had for Q1.
Similar to Quora, our educational channel is indeed producing tangible results. We’ve seen people in our CRM who had been inactive with our brand for months suddenly get fired up after watching a few videos and then submit a business for sale or verify their liquidity on the buy side.
The comments we get on the videos are mostly positive. The video production isn’t the best it could be, but we work in a more casual industry in many ways and this is likely not as important for results versus producing high production-value, high budget-style videos. In general, people want to talk to other relatable people.
The problem we ran into with the YouTube channel is the same problem that often afflicts any solid content marketing campaign:
Consistency.
In Q1 we published far fewer videos than we hoped and this almost certainly played into the slow growth. YouTube is a great devourer of content and if you’re not producing regularly, then your traffic can fall off sharply. This is especially true if your channel is newer and less established, like ours.
Another issue is that we probably did not do as good of a job as we could have to promote these videos to our audience. This is something we’re looking to do more in Q2 and especially in Q3, after a round of marketing hires get up to speed to allow us more capacity for producing larger amounts of content.
At the moment, we are passively getting thousands of views even with this low publishing rate. We’re still incredibly bullish on achieving solid results from this channel, though, and we are by far from done working with it.
Here are our top-viewed videos for Q1:
- Leveraging the Asset Flywheel to Build Wealth in Online Business
- Amazon Affiliate Marketing for Beginners – Learn What It is and How It Works
- How Do Valuations for Small Companies or Online Businesses Work?
The Soft Power of YouTube Ads
On a related note, we also ran a small number of YouTube ads in Q1. This led to our discovering a soft power with YouTube Ads that you may never have considered. This soft power could work in a B2C environment, but it is likely to be especially effective in a B2B arena.
We ran ads with me doing a talking head video that led to several viewers filling out our valuation tool. The ads struggled in their reach, but that was more likely due to our skill in running the ads than the platform itself.
The soft power of all this came into play as I was lit up across social media and entrepreneur friends saw my videos, a solid sign that our targeting was on point. The culmination of the real soft power reach of YouTube ads happened during a recent Clubhouse room I ran specifically for Shopify entrepreneurs. I dropped into the room simply to listen in and suddenly found myself moderating the group.
Why?
The owner of the group had recognized me from the YouTube ad. He brought me up on stage and had the audience ask me questions about selling their Shopify stores. He capped it off by asking me if I was real-life retargeting him by appearing in his group!
We’re not running any YouTube ads right now, but this kind of soft power combined with a solid, scalable campaign is definitely something we will be working on in the future.
Podcasts and Shows
Podcasts remain one of our favorite mediums to produce content in. We have four main shows that we produce:
We generated 73,141 downloads across all of our shows.
Let’s dive into each one to see what happened in Q1.
The Empire Flippers Show
The Empire Flippers Show is our flagship show as well as our longest-running one. Our co-founders, Joe Magnotti and Justin Cooke, get together and do long-form interviews with wildly successful entrepreneurs in the digital space or discuss their inside knowledge of the industry as a whole and where things are going.
Here are our downloads for Q1:
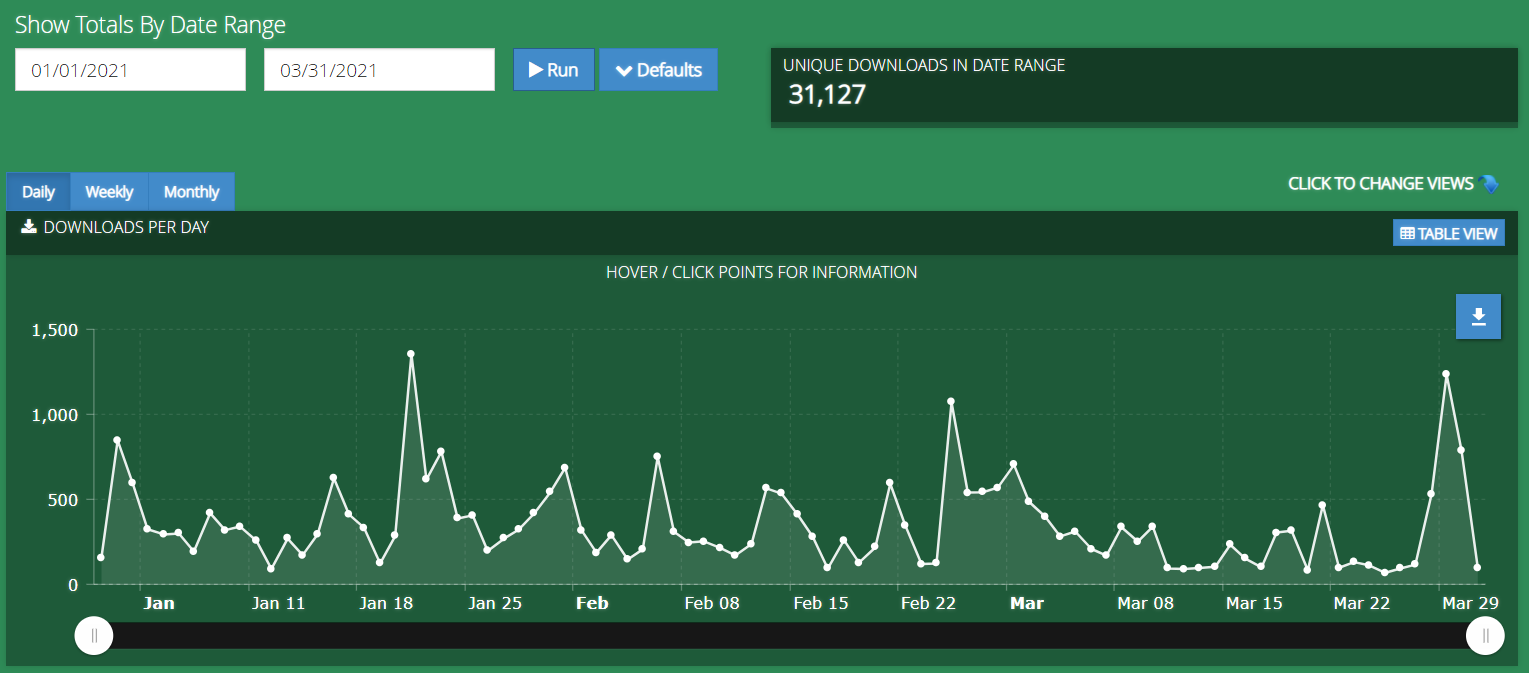
In Q1 we had 31,127 downloads of the Empire Flippers show. Unfortunately, we didn’t publish many new episodes. This means the vast majority of the downloads came from passive content marketing, such as people finding us in an app store, our podcast page, or some other method of content marketing.
In many ways this is similar to our Quora, where we put in the work once and now reap the rewards day-in and day-out whether we do anything at all. That is by far our favorite way to market our business because over time, it can create an absolute avalanche of traffic for us that our competition simply isn’t willing to put in the work to create.
Here are our top three most listened to episodes for the quarter:
The Web Equity Show
The Web Equity Show is a joint partnership between Ace Chapman and co-founder Justin Cooke. In each season they focus on a certain theme. Sometimes the theme is angled towards buyers, and at other times it is angled towards sellers.
Here are our downloads for Q2:
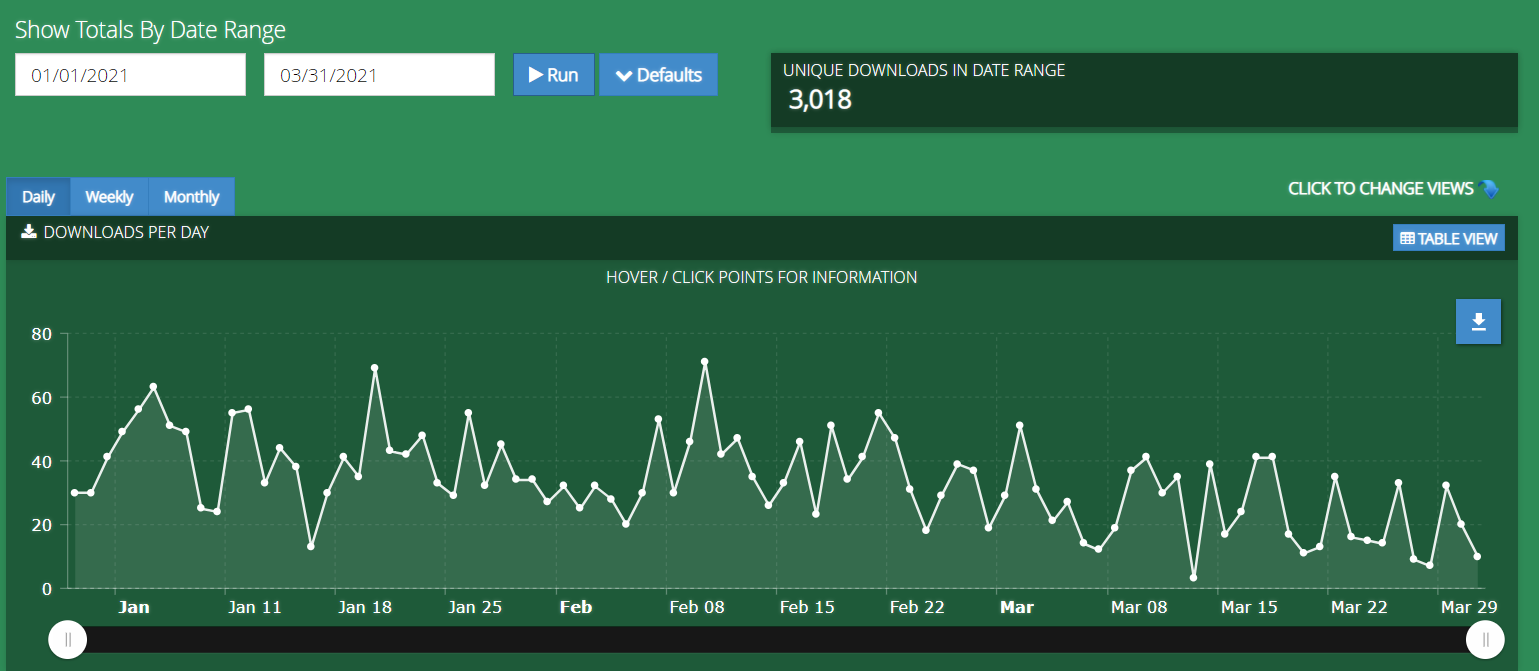
In Q1 we had 3,018 downloads. We have not published new episodes of this show in several quarters, but we’re still seeing that passive content marketing working in our favor to keep the podcast live.
While it is uncertain whether we will do another season of the Web Equity Podcast, we’re convinced that the first few seasons of this show provide some of the best well-structured advice in the entire industry, whether you’re a business buyer or seller.
Here are our top three most listened to episodes for the quarter:
Real Money Real Business (RMRB)
RMRB remains our most prolific show by far. Every time a seller is listed on our marketplace and their valuation is above $100,000, we’ll invite them to do an interview with us.
This means every guest is someone that is in the trenches, does the work, and is a real entrepreneur. One thing that makes this podcast so unique is that we’ve actually seen their P&Ls. In fact, we’ve helped these entrepreneurs build their P&Ls considering that they’re selling on our marketplace.
RMRB serves both as a sales tool for our audience looking to buy a business and as a way to inspire entrepreneurs to what is possible by sharing the stories of successful bootstrap founders of profitable companies.
Here are our downloads for Q2:
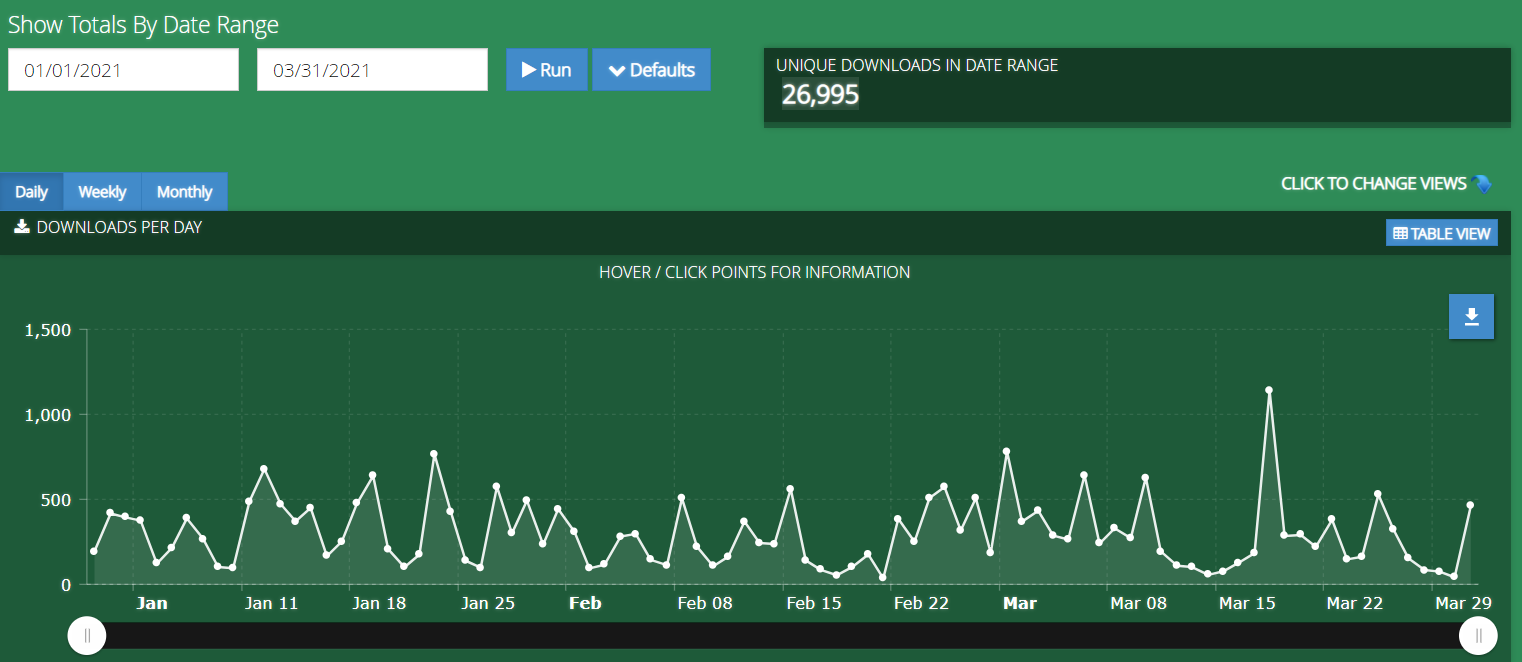
In Q1 we had 26,995 downloads of RMRB, making it our second largest podcast show. We have such a high volume of sellers being listed on our marketplace every week that we see no slowing down of the sheer quantity of episodes coming out.
Here are our top three most-listened-to episodes for the quarter:
- RMRB 246: Building a 6-Figure Affiliate Business in Evergreen Niches
- RMRB 226: Growing a 5-Figure Business in the Health & Fitness Niche by Producing Quality Data-Backed Content
- RMRB 252: Building a 6-Figure KDP Business
The Opportunity
The Opportunity is the newest show on our podcast roster, co-hosted by Sarah Nuttycombe and Branden Schmidt.
Every week they interview a business buyer. You’ll hear stories from scrappy entrepreneurs all the way up to brand aggregators who have raised tens of millions in capital to buy digital businesses.
We wanted to show what it is like being a business buyer and give you a deep behind-the-scenes look at how the process works from an actual customer perspective. The majority of these interviews are done with personal buyers on our marketplace, but we also feature other types of buyers and even domain experts in a variety of internet marketing strategies.
Here are our downloads for Q1 2021:

We hit 12,001 downloads last quarter, which is the first real full quarter the podcast had under its belt. The audience is growing and we’re hoping for even more downloads in Q2. Building a new show takes a ton of time, effort, and coordination but we believe we can make this a mainstay of our podcasts.
Here are our top three most listened to episodes for the quarter:
- The Opportunity Ep.19: Amazon FBA Advice From the Fastest Profitable Unicorn in US History
- The Opportunity Ep.23: How an SEO Master Scales New Acquisitions
- The Opportunity Ep.18: Using Small Acquisitions As Practice for Large Acquisitions
Email and Contacts
Email remains one of the cornerstones of our marketing machine.
By the end of Q1, our email subscribers sat at 118,167 subscribers. A big struggle for us has always been reducing our unsubscribe rate. While Q1 had a relatively normal unsubscribe rate, toward the end of Q1 we dreamed up a new way of doing email marketing that has so far vastly reduced our unsubscribe rate.
A part of this email rework was removing the majority of our automated funnels. Instead, we replaced them with a short email follow-up that helps the subscriber on the next part of their journey. In addition, we’ve created more audience segmentations than we’ve ever had before.
The audience segmentation is key, because while we are sending far fewer automated emails, we are actually sending far more broadcast-style emails. These broadcast emails are laser-targeted to audiences based on their interests, actions, and levels of engagement with us.
This kind of email system is far more complex than what we used to have, but allows us to reach our audience far easier in ways that will engage them.
A recent example was an email we sent out to business buyers interested in Amazon FBA. The audience segment we used was far smaller than the audience we used for the Featured Listings email we send out every week. Despite this, the email outperformed the old Featured Listings email seven times over.
As time goes on, the Monday listings email will likely be the only one that goes out to our entire list. All the other emails will be laser-focused on smaller segments of our audience.
The idea is that we will be able to create super-engaged segments by doing this. So while people are getting less email than ever from us, we are actually writing more emails than before. They just aren’t seen by most people as most people won’t fall into the category targeted by a specific email.
This system has already produced stellar results for us in terms of click-through rates, engagements, and a huge reduction in unsubscribes. It will be a few more months before we know just how successful this change has been, but all signs are pointing to it being very positive for everyone involved.
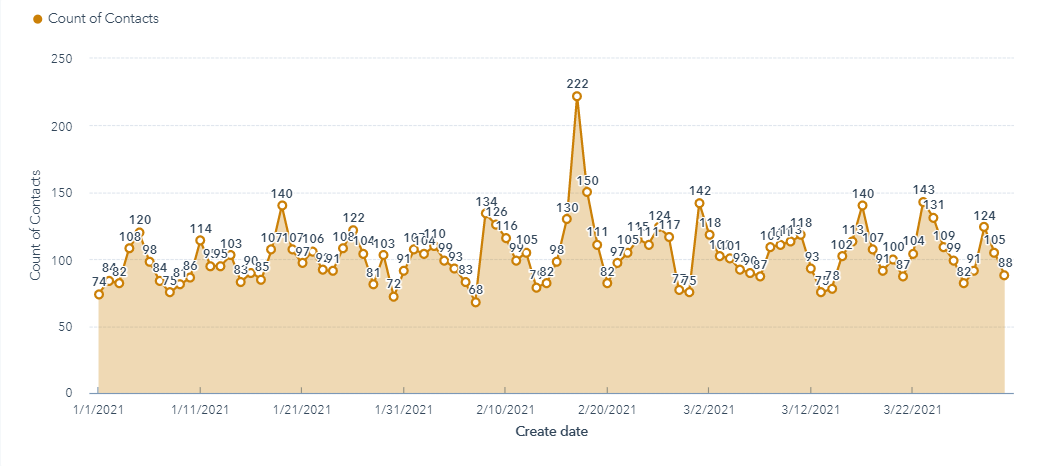
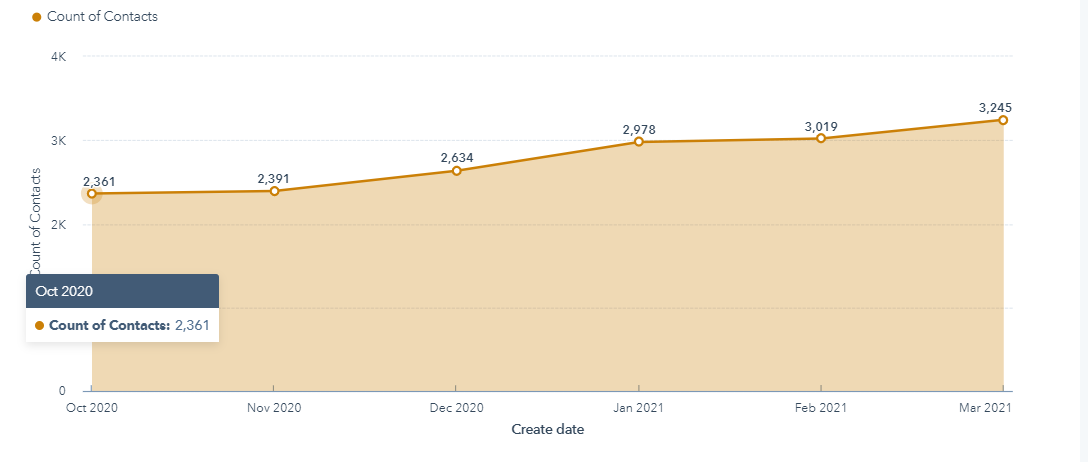
Here is a chart of our subscriber growth in Q1:
 Here is a look at the same chart with Q1 2021 and Q4 2020 combined:

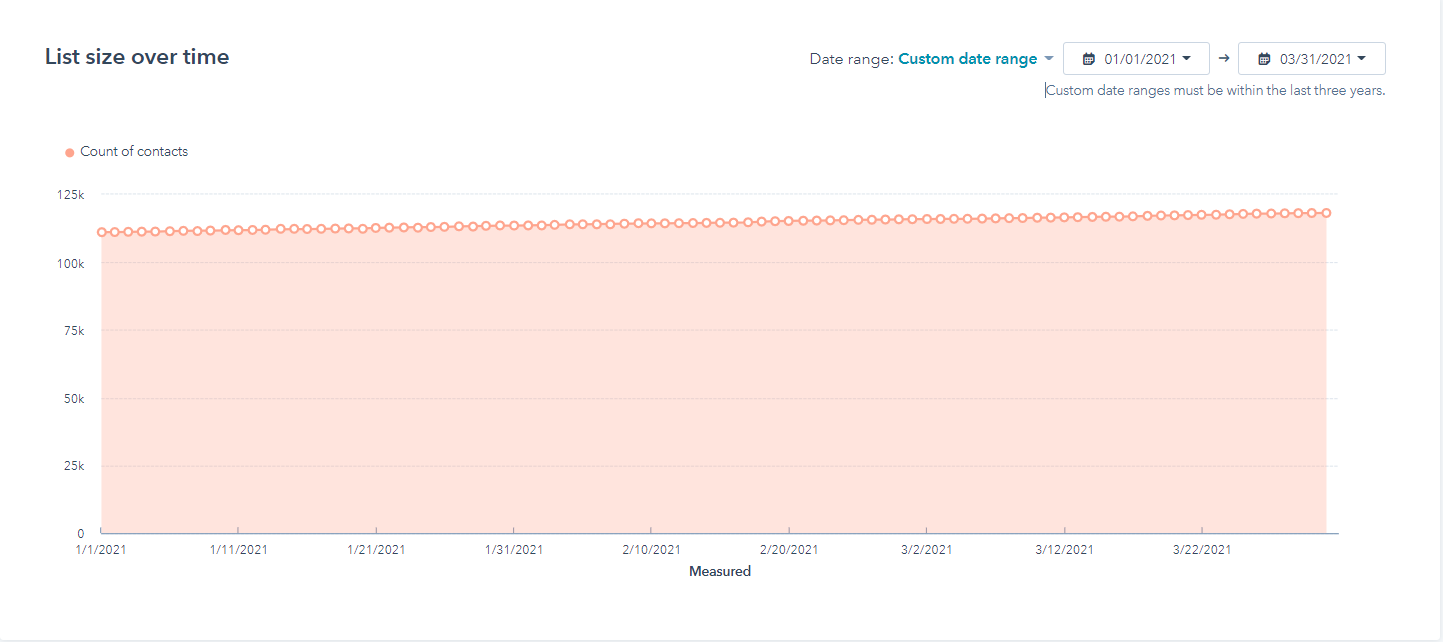
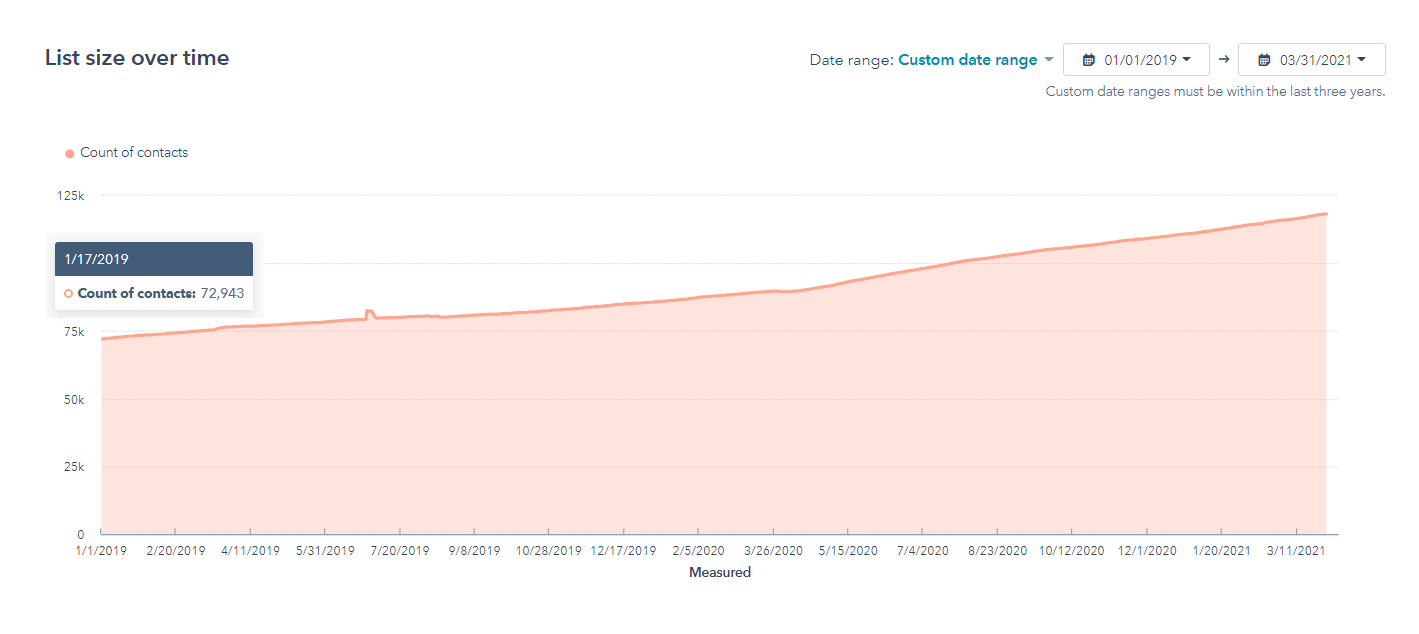
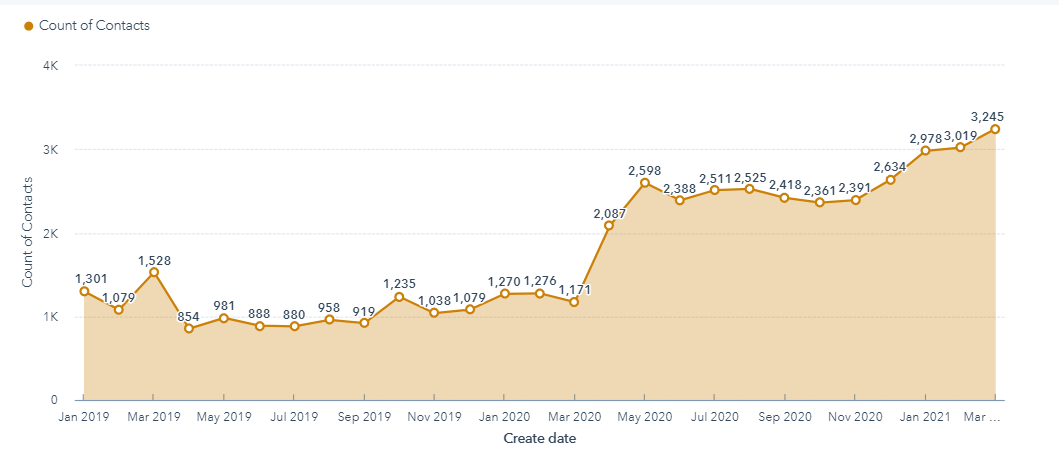
Here’s our list size growth over the past three years:
Contacts Breakdown:
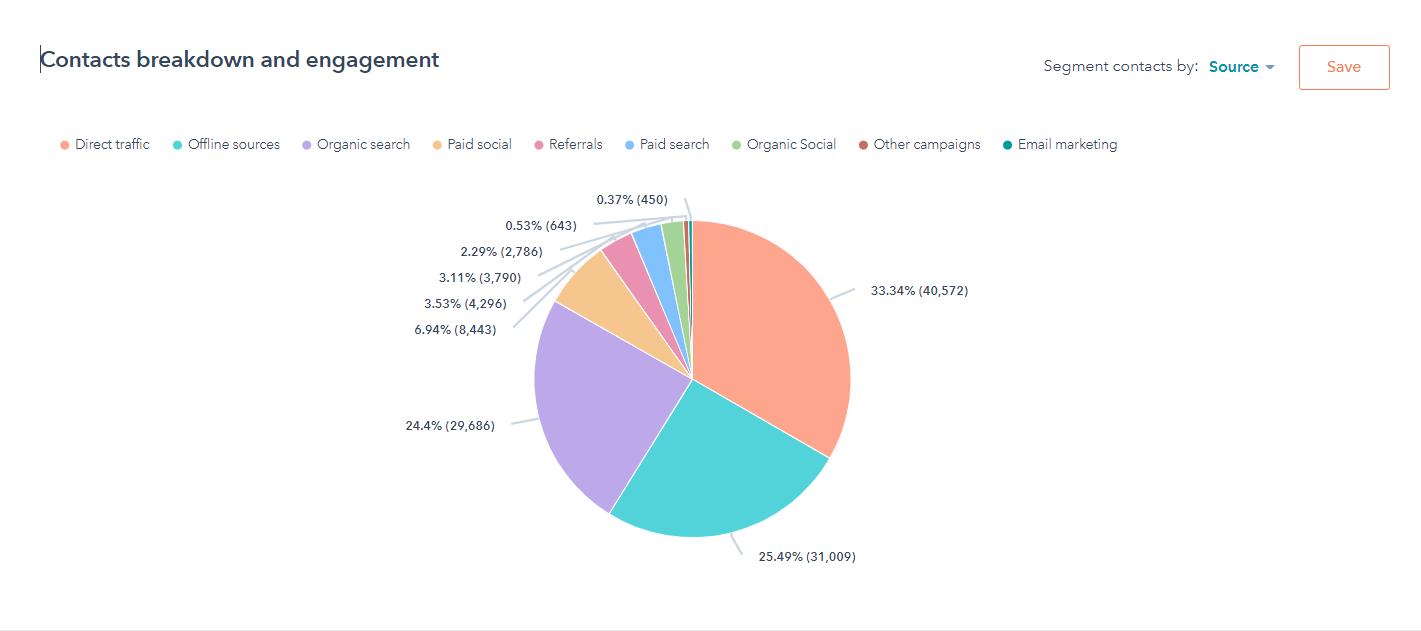
As you can see, the vast majority of our contacts come from direct traffic, the bane of every marketer’s existence since it is impossible to truly know where they came from. The one nice thing about this is that our subscriber rate is growing and so is our direct traffic. The same goes for offline sources, which are other untrackable events for the most part.
This tells us that our brand awareness is growing by leaps and bounds. While we can’t track where they are coming from exactly, we are confident that our brand is aggressively expanding into the mindshare of entrepreneurs and investors worldwide.
Organic search remains the lion’s share of our contact creation, which makes sense considering how much effort we put into content and SEO.
A big push in 2021 is expanding our traffic channels by testing them out and hopefully scaling one before the end of the year. We have seen some reward for this effort in our email list, with paid advertising channels producing a slew of new subscribers. However, this is still a very small overall part of our marketing machine right now.
Customer Experience
Customer experience remains a top priority for us. When you’re running a service business, it really is the most important thing to focus on. We want each customer walking away feeling great that they engaged with us, whether they actually bought or sold anything on the marketplace.
Our sales cycle is so long that each time we can have someone walking away feeling great about their interaction, it’ll pay us dividends a year or two down the road.
So, how did we do in Q1?
Customer Feedback
Unfortunately, we can’t share our actual feedback with you for Q1. The reason isn’t that we don’t want to, but rather that Zendesk has changed how they present the reporting. The new reporting dashboard is, well, worse.
Hopefully, this changes and we’ll be able to present these data again. If it does change and we can go back to Q1, we’ll update this part of the blog post to show those comments.
Instead, we’ll talk broadly about what we saw in Q1.
The vast majority of negative feedback came as a result of our rejecting businesses from our marketplace. No entrepreneur likes the feeling of being told their business isn’t a fit. Still, we’re okay with this and view it as the vetting process working as intended.
Presently, about 92% of businesses submitted to our marketplace are rejected. Considering we can get 150–200 businesses submitted to us per week, this can lead to quite a few negative comments.
When it comes to positive feedback, we got great marks on our communication with buyers and sellers. In this heated seller’s market, we’re getting fantastic feedback from sellers who are incredibly grateful to have our service to help them navigate different buyer offers and deal structures, and really being in their corner to help them get the best possible exit.
If you want a bit of an inside scoop on this kind of feedback, check out our Opportunity episode where we interviewed an entrepreneur who went from living on $10,000 per year to selling an eight-figure Amazon FBA business using our marketplace.
You can listen to that episode here.

What Happened in Q1 of 2021?
There were failures, successes, and quite a bit of news for us in Q1 2021. Let’s dive into the events that transpired.
The Quick Death of the Medium Magazine
At the end of 2020 we announced that we were launching the Digital Investor magazine. The whole reasoning behind it was that Medium looked like an amazing source of conversion traffic for us in Google Analytics. We’d see small dribbles of traffic from Medium with unexpectedly high conversion rates for important marketing KPIs, like verifying their liquidity and filling out our valuation tool.
We even saw people selling their businesses with very little lag time from the moment they came to our website from Medium to actually submitting their businesses for sale.
In Q1, our content team ran a long marathon, pumping out dozens of articles for the platform and the Digital Investor magazine. At first the trickle of traffic we were getting was consistent with what we saw in Google Analytics. However, as our content vault grew, we noticed the traffic wasn’t growing at all.
No matter what we did in terms of content promotion and production, we could not lift the Medium traffic numbers up in any meaningful way. Obviously, this took a ton of time and effort; sadly, it ended in failure.
In marketing, the vast majority of what you do won’t work. It’s the nature of the game, and this is especially true when exploring new traffic channels. Part of the game, though, is knowing when to quit because the labor cost far exceeds the benefit. Seeing where Medium was going for us, we made the call to stop producing on the platform.
We may still produce guest content for other publications on Medium as there is likely a lot of value we can get from doing this, but running our own publication doesn’t make sense when we consider the work versus the reward.
Medium is a cool platform and there is a strategy to add it to the mix, but the publication isn’t one of them. We’ll likely be better served by using the platform to target specific publications and getting our articles featured that way versus trying to take on the entrenched Medium algorithm.
Exceeded $3 Billion in Verified Funds
In more positive news, we crossed a massive milestone in Q1.
When we started tracking how much proof of funds our buyer network actually has in order for them to unlock a listing on our marketplace, we were shocked when a few months in the metric showed more than a billion dollars.
Well, we’ve blown the original billion dollars out of the water.
We now have more than $3 billion worth of investable liquidity from our buyer network on the marketplace. The most remarkable thing is that $3 billion is just the official number.
The unofficial number is likely several orders of magnitude higher than $3 billion.
The reason is because when a buyer wants to look more deeply at a business, they’re usually only going to show us their net worth up to the amount needed to unlock it. This means that under most circumstances, they have liquidity above and beyond what they are showing us.
All of this is fantastic news for the M&A online business space.
Never has there been more money in the industry than today. If you’re an entrepreneur looking to sell your business, then right now is the absolute best time we’ve ever seen to sell. Not only is the market flush with cash, but the buyers are ravenous to acquire quality, premium businesses with solid cash flow.
Became the M&A Market Leader for Selling Amazon FBA Businesses by a Wide Margin
If you haven’t read our State of the Industry Report yet, then you may not be aware of this fact but…
Q1 has firmly cemented us as the leader when it comes to selling and buying Amazon FBA businesses.
Not only did we sell a huge amount in Q1, but we sold literally dozens throughout 2020. We now sell more Amazon FBA businesses than any other M&A broker, whether that is a small $30,000 side hustle or a huge eight-figure enterprise.
We’ve been the market leader when it comes to content sites for years now. One could argue we’ve been the market leader for Amazon FBA businesses for years too, though after 2020 and the start of Q1 2021, there is no shadow of a doubt anymore.
This is an awesome achievement from our perspective and we’re honored that so many Amazon FBA entrepreneurs choose us and trust us to help them make the biggest, most profitable exit possible.
While we’ll dive deeper into our industry report below, if you want to see a recent look at valuations for Amazon FBA, check out our Season of the Seller post here.
Launched State of the Industry Report
Every year we analyze, write, and publish a huge State of the Industry Report.
This report features literally hundreds of businesses we’ve sold on our marketplace over a three-year period. We compare the overall marketplace value and macro trends, and then dive deep into individual monetization such as content and ecommerce.
Our readers have loved the report and they’ve given us great feedback to help make the report better each time we work on it. This year we gave far more clarity on earn-out tracking, what kind of upfront amount you can expect for a business you sell, and we went super-granular with the Amazon Associates and Amazon FBA business models.
We were able to look at a variety of pricing tiers in each of these models and provide real data, simply because we sold so many of them.
In addition to this deeper insights section, we’ve also started using the trailing-twelve months average (TTM) in the report for our multiples. We know the way we do multiples can be confusing for someone who is unfamiliar with our process but has seen how other brokers price businesses, so we thought we’d start by showing the TTM multiple in the report just like we do on our scoreboard.
You can watch me break down the parts of the industry report in this video:
If you want the full analysis, click here to download the State of the Industry Report.
First Taste of Success with Paid Media
While building out a solid marketing channel via Medium failed for us, one thing that is showing signs of success is paid media.
We’ve always been a content-first organization with media buying being more of an afterthought. As we grow and expand, however, we see the real power of media buying done well.
In Q1 2021 we generated over $10 million in verified liquidity from brand-new buyers registering an Empire Flippers account. We recently sold a six-figure Amazon FBA business, and have a seven-figure Amazon FBA business listed on the marketplace.
All of this from the power of ads.
Now, running any kind of media buying campaign in our space is incredibly difficult and complex. There are many factors to consider, a long sales cycle not being the least among them. It can be very messy trying to determine which campaign is right to scale and which is right to kill.
While we haven’t figured all of this out just yet, we have tasted enough early success to dedicate more resources to media buying going forward. We see all kinds of potential outside of just direct response-style marketing. A good media buying system could put our already fairly robust content marketing engine into overdrive.
The beautiful thing about focusing on SEO and inbound for so long is that our customer acquisition cost is quite low. This means we can play with media buying in ways others just simply cannot because they have not put in the time and effort to build out that avalanche of organic traffic.
That said, we’re currently looking for an expert media buyer to join our team in-house. Check out our careers page if you’d like to apply.
It will be a tough job, considering that this is one of the hardest niches in which to run effective ads. After all, you’re targeting the crowded make money online space, then going further into the subset that actually does make money online, and then you’re facing running ads in front of people who most likely are seeing ads all day long themselves already because they’re creating them for their own businesses!
It’s a tall order, but for the right person this could be an explosive job position.
The Eight-Figure Threshold
At the tail end of Q4 2020, we sold our first eight-figure business. In Q1 of 2021, we are on the verge of selling our third eight-figure business.
This is important for several reasons. First, when you run an M&A brokerage, you have a bit of the chicken-and-egg problem. Sellers don’t want to use you if you’ve never sold a business that is a similar size to theirs, and of course without the business to sell you can never prove to the seller you can do it.
That is why selling the first business at any price threshold back in the low six-figure days to our first seven-figure business is such a huge deal. It is a signal to the entire market that yes, we can indeed sell businesses of that size.
Once we break that threshold, we start marketing the fact that we did and that signal starts spreading to other entrepreneurs. It builds that all-important faith that we can get the job done for them.
It is the start of an onslaught of similar sized businesses that want to take advantage of our M&A services to make that huge, life-changing exit.
History is repeating itself and not only have we sold two more eight-figure businesses within a few months of selling our first one, but we also have a ton of new sellers who just entered our vetting process and are going to be hitting that eight-figure valuation.
If you want to see what it is like selling an eight-figure business, then check out this case study about the $11.8 million Amazon FBA business we sold.
EF Capital Operators Funded (And First Acquisition in Q2!)
EF Capital (EFC) is off to the races.
If you’re unfamiliar with EFC, it is a new arm of our business where we are connecting accredited investors with talented entrepreneurs to act as operators. One of the goals of EFC is to help make the traditional, very active investing nature of buying a digital business more hands-off and passive for the investor.
You can read more about EFC here if you want to see how it works.
In Q1 2021, we funded five of the six operator deals we featured. This is the first proof of success that EFC can work. After all, without solid funding there are no operators buying businesses. Our hope is that in time, EFC will become a marketplace of funds, with far more deals being featured.
The sixth that fell through at the end wasn’t gaining any traction in terms of investment, so we ended up closing it to focus on the five we did fund. This was not an unforeseen event. We always figured that some deals just simply won’t get the funding they’re asking for, so this wasn’t totally unexpected.
The total amount raised for this round of funding was $7.5 million. Right now, all the operators are on the marketplace hunting for solid businesses to acquire. At the time of this writing, we’ve had three acquisitions from the EFC operators with more to come.
As the program develops, we will start writing more about the news and updates to the program. If you have yet to subscribe or follow the Opportunity Podcast on Apple Podcasts or Spotify, then I highly recommend you do so if you’re interested in EFC updates.
Once more acquisitions have happened and we enter the third phase of EFC with operators actually stabilizing their acquisitions, we will be bringing a few of them onto the show to talk about their experiences and lessons learned.
And That’s a Wrap!
There you have it.
Q1 2021 was an intense quarter for us with a lot of new record-breaking achievements.
Hopefully you found this report incredibly helpful not just for keeping up with what we are doing, but as something that inspires you to ever-greater heights in your own business. After all, the real reason why we write these is to inspire others to achieve greater things in their own personal economies.
If you’d like to buy a business with us or look at what’s for sale, make sure to sign up for a free Empire Flippers account.
If you’d like to sell a business with us for a lucrative exit, you can do that here.

