Q4 2021 Report: October, November, December
 Updated on April 15, 2022

It’s time to look back on what we’ve done this past quarter and year, with the numbers to tell the story of what was accomplished.
Ending 2021 was no small feat. We had an incredible year at Empire Flippers and saw a solid culmination of one of our best years in Q4 2021.
Every quarter, we produce this report as a commitment to our core value of transparency. We want to be open about what went well and what went wrong so that others can learn from our own winding journey. We hope this report will help your business this year.
Note that if you’re ready to make an exit, you don’t have to wait till the end of the report to sell your business with us.
We’ll start by diving deep into our actual marketplace financials; then we’ll discuss our traffic channels to share lessons learned. Finally, we’ll talk about all the milestones across departments in Q4 so you are in the know on the happenings on the Empire Flippers marketplace.
Executive Summary
Q4 2021 Business Data
Business Data
Total team members: 93
- Founders: 2
- Sales team members: 22
- Marketing team members: 11
- Operations team members: 32
- Engineering team members: 10
- Human resources team members: 2
- Finance team members: 3
- Contractors: 2
Email subscribers: 9,775
Podcast downloads: 11,632 (The Opportunity) + 27,377 (Real Money Real Business) + 8,372 (Empire Flippers Podcast) + 1,382 (Web Equity) = 48,763
Site visits: 219,800
Financial Data
Revenue
Brokered site sales: $38,676,249.95
Other revenue: $25.47
Average deal size: $499,722.71
Total revenue: $38,676,275.42
Earnings
Brokered site earnings: $3,556,540.17
Earn-out payments: $205,582.58
Additional revenue: $2,474,780.52
Total gross earnings: $3,556,565.64
Businesses For Sale Right Now: Eight-Figure & Seven-Figure Listings
1. Listing #60180: This listing is for an Amazon FBA and eCommerce business created in March 2018 in the home and outdoors niches. Included in the sale is an Amazon Seller Central Account registered with Amazon Brand Registry that features 448 SKUs for leisure products in the pool and spa industries. 85% of sales come from the top 20 SKUs and only 50 SKUs are actively promoted. The best-selling SKUs have thousands of 4.8-star+ reviews, with all other SKUs having hundreds to thousands of positive reviews. The business has experienced strong year-over-year growth and requires minimal time from the Seller thanks to its three employees and outsourcing of logistics. This business is valued at $20,887,973.
2. Listing #59664: This listing is for an Amazon FBA and eCommerce business created in November 2013 in the kitchenware niche. The business is part of Amazon Brand Registry and features 8 unique products related to grilling and welding protection. The products have excellent reviews with the top-rated listing having 4.6 stars across 4900+ reviews. The business features high profit margins of 35% and generates a portion of its sales from recurring wholesale orders. This business is valued at $1,504,974.
Revenue Breakdown
Brokered Site Revenue
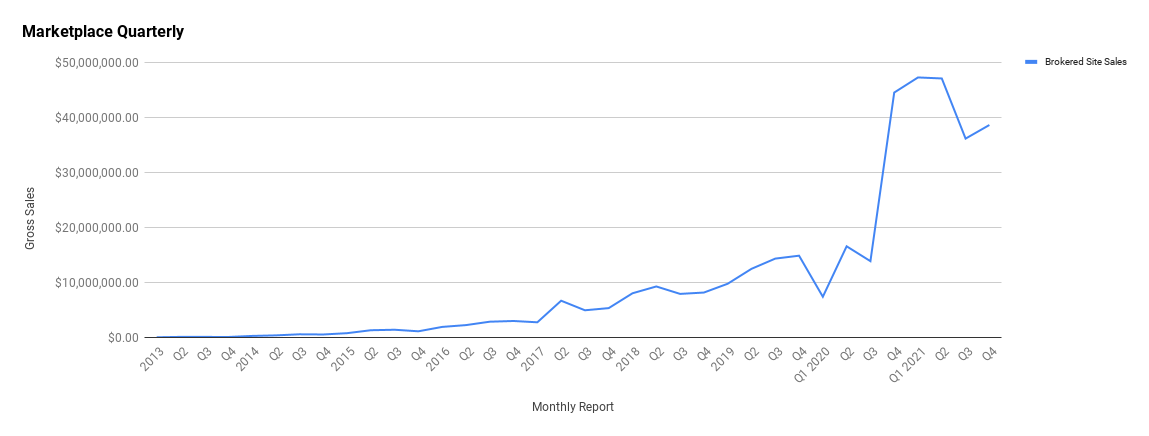
In Q4 2021, we sold $38,676,275.42 in brokered businesses on our marketplace. This is slightly up compared to Q3, which was $36,201,468.22. These numbers make sense, as we tend to see some of our highest volume of sales in the last quarter of the year.
Before the year end is usually the culmination of extensive exit planning that takes place throughout the year. Sellers diligently plan for their big exit, and by Q4, they’re finally ready to list their business for sale.
Sellers are also keen to exit before the year end to take advantage of tax benefits before a new year begins. They can capitalize on holiday sales boosts within their valuation and position the potential for increased sales as an incentive for buyers. In the same vein, buyers like to pick up businesses that will be experiencing some of their best months to get a head start on recouping their investment.
The year-end bump can also be attributed to aggregators in need of securing the right deals before the year end. This is because they are still held accountable to their investors, and all the capital they raised throughout 2021 would need to start being deployed into acquisitions.

Our average deal size also increased from that in Q3, landing at $471,661.58 for the quarter. This is roughly $60K more than the previous quarter but overall a decline from the $500K averages we saw in Q1 and Q2 of 2021.
Again, the year-end spike puts all the increased year-end averages for Q4 into perspective. However, taking a step back to examine why the numbers might have come down from Q1 and Q2 requires a more holistic examination of the industry at large.
Although we’ve talked about this at length in our content, it’s worth repeating—the supply chain crisis has had ramifications on the world and, of course, everyday business owners in ecommerce and Amazon FBA.
The soaring demand for online goods came head to head with the supply chain’s ability to deliver those goods. With each ship that was locked up in harbors waiting to be processed, the strain could be felt across every other means of transporting goods. The options to circumvent one clogged shipping route would become strained, leaving online sellers to scramble and resort to the most expensive shipping options to keep their businesses afloat.
Adding the highly virulent Omicron Covid-19 variant to the mix and the corresponding lockdowns that followed, you have the makings of a stressful market environment compared to the buoyancy of mid 2020–mid 2021.
To bring it full circle, with the shipping crisis and the pandemic in mind, businesses were expected to take a hit. Conversely, it also makes sense that we would see slightly higher numbers of businesses looking to exit before enduring more hardships.
Businesses want to exit on a high (while they can), which led to our former prediction of seeing more eight-figure exits coming true.
We already reported on our first eight-figure deal earlier in 2021. As Q4 kicked off, we sold two FBA businesses for $12M and $11.8M.
This is huge. Already into 2022, even larger eight-figure deals have come to our marketplace, solidifying our ability to use our process to close larger deals.
Now that seven-figure deals have become commonplace and the trajectory seems to be going upward, the average deal size data will likely increase to mediate between our largest and smallest deals.
Here is how our average deal size in the marketplace has changed over time:

Keep in mind looking at all these numbers what our cut of the pie truly is. The earnings we took home in Q4 totaled $3,556,540.17. That’s up from Q3 but down from the height of 2021’s Q2 earnings of $4,101,403.95.
As we continue to build on earnout reporting, the data from this quarter showed that it closely followed Q3’s performance. We earned $205,582.58 from earnouts in Q4, not far behind one of our biggest quarters of earnout earnings—Q3—that came in at $277,985.50.
Despite slight fluctuations in quarterly performance, we exceeded our goals; this is a testament to the performance of our team, the strength of buyer demand, and the increasing quality of the businesses sold.
2021 was a transformative year for us and for all the sellers who were able to walk away with life-changing exits. We have now crossed the threshold of minting 69 sellers as millionaires on our marketplace.
Even in the midst of a pandemic, shipping crises, and other world events, it is meaningful to look back on the data and know that on both sides of the deals we brokered, there were people who were creating hope and positive change for themselves and their families. We hope that no matter what 2022 brings, we can still continue to facilitate as many life-changing exits as possible for our buyers and sellers.
Traffic and Audience
Blog Traffic and Analytics
Empire Flippers was born as a blog that grew into a sophisticated marketplace. Our initial purpose was to provide valuable articles to help readers learn about flipping websites. Our commitment to providing the most helpful content in the industry hasn’t changed.
Overall, our blog and website have remained fairly consistent in terms of leading our traffic and revenue.
We’re driving a similar amount of users as that in Q3, although session duration did become longer in Q4. We imagine this is related to providing more niche value-led content as well as experimenting with new content formats in Q4.
We expanded outside of pure SEO plays in the final quarter of 2021 to experiment with short form, news-driven content alongside our traditional pieces. The underlying idea was to capitalize on the research we had been doing on our newly launched This Week in M&A (more news on that in the email section) and to take the opportunity to give our own advice based on what was happening in the industry. We then turned the research and written articles into YouTube scripts, social media assets, and potential partnerships.
As our newsletter grows in popularity, we anticipate it could help drive even more traffic to our content as we focus on building a newsletter community. The newsletter’s end goal would be to bring in interested readers who want a trusted resource on M&A, even if they are entirely unfamiliar with us or our brand.
Here’s how Q4’s traffic data played out:

Here are our top referring channels:

Three Most Viewed Pages
Three Most Viewed Listings
- #56714: This listing is for a display advertising business created in March 2020 in the social media niche. The WordPress site aggregates viral content from social media and drives traffic through a network of Facebook pages. This business is valued at $9,006,021.
- #56827 (Pending Sold!): This listing is for an Amazon FBA and ecommerce business created in December 2015 in the sports and health & fitness niches. The included Amazon Seller Central account features 760+ SKUs under ten different brands, five of which are trademarked and registered with Amazon’s Brand Registry 2.0 for branded sports and fitness products. This business is valued at $12,350,343.
- #55919: This listing is for an Amazon Associates and affiliate business created in May 2019 in the health & fitness niche. The WordPress site features reviews on a wide variety of nutritional and personal care products. The business benefits from being in a niche with growing popularity, and the site has good traffic diversity. The business is valued at $24,545.
Three Most Viewed Pieces of Content
Three Most Viewed Pieces of Content: Q4 2021
- Case Study: The Fastest Million Dollar Website We’ve Ever Sold
- 7 Ways to Improve Your E-Commerce Supply Chain
- Why 91% of Businesses Don’t Pass Our Vetting Process (and How to Improve Your Chances of Getting Sold With Us)
We have hinted to this before, but as 2022 is underway, we’ve refocused our technical SEO efforts. We are working with SEO experts to optimize the abundance of content we have published over the years as well as to help us go after more competitive keywords in our industry. Stay tuned for updates on how it all turns out!
Educational YouTube Channel
We continue to build our secondary YouTube channel with educational content.
We clocked in at 5,991 views for Q4 and an extra 178 subscribers to the channel. Although this is slightly down from Q3’s performance, in this quarter, we had held off on ad spend for the channel, which could explain the decrease.
Here are our analytics for Q4:

As previously mentioned in our blog content, we brought timely, news-driven content over from our newsletter and blog to some of our YouTube videos. This was a change of pace to weigh in on something while it was hot, so to speak.
We’re still bullish on YouTube’s potential, despite the minor decrease in views this quarter.
We outlined our strategy last quarter for the channel and still believe it’s our next frontier. Moving into 2022, building community has been a focus, so YouTube will be a critical part of building out a real community presence. It gives us leverage to connect in a more personal way than blogs and allows us to distribute content to audiences outside of our general sphere.
Bringing on a YouTube producer has also been important in tackling growth on this channel. With a dedicated producer and editor, we expect our ability to deliver video content to multiply.
Here are our top viewed videos for Q4:
- The Eight-Figure Media Company Business Model Part 1
- Amazon Affiliate Marketing For Beginners—Learn What it is and How it Works
- What is a Business Broker? Do You Need One to Buy Or Sell a Business?
Also worth sharing is our expert panel webinar on preparing your Amazon business for a lucrative exit. This turned out to be a great collaboration with other leaders in the industry and we’ve had positive feedback on what was offered in this discussion.
Podcasts and Shows
Empire Flippers Podcast
If you’ve known us for a while, you likely first got to know us via the Empire Flippers podcast.
It’s been quite some time since our founders, Justin and Joe, released a new episode interviewing guests or discussing their take on online business building.
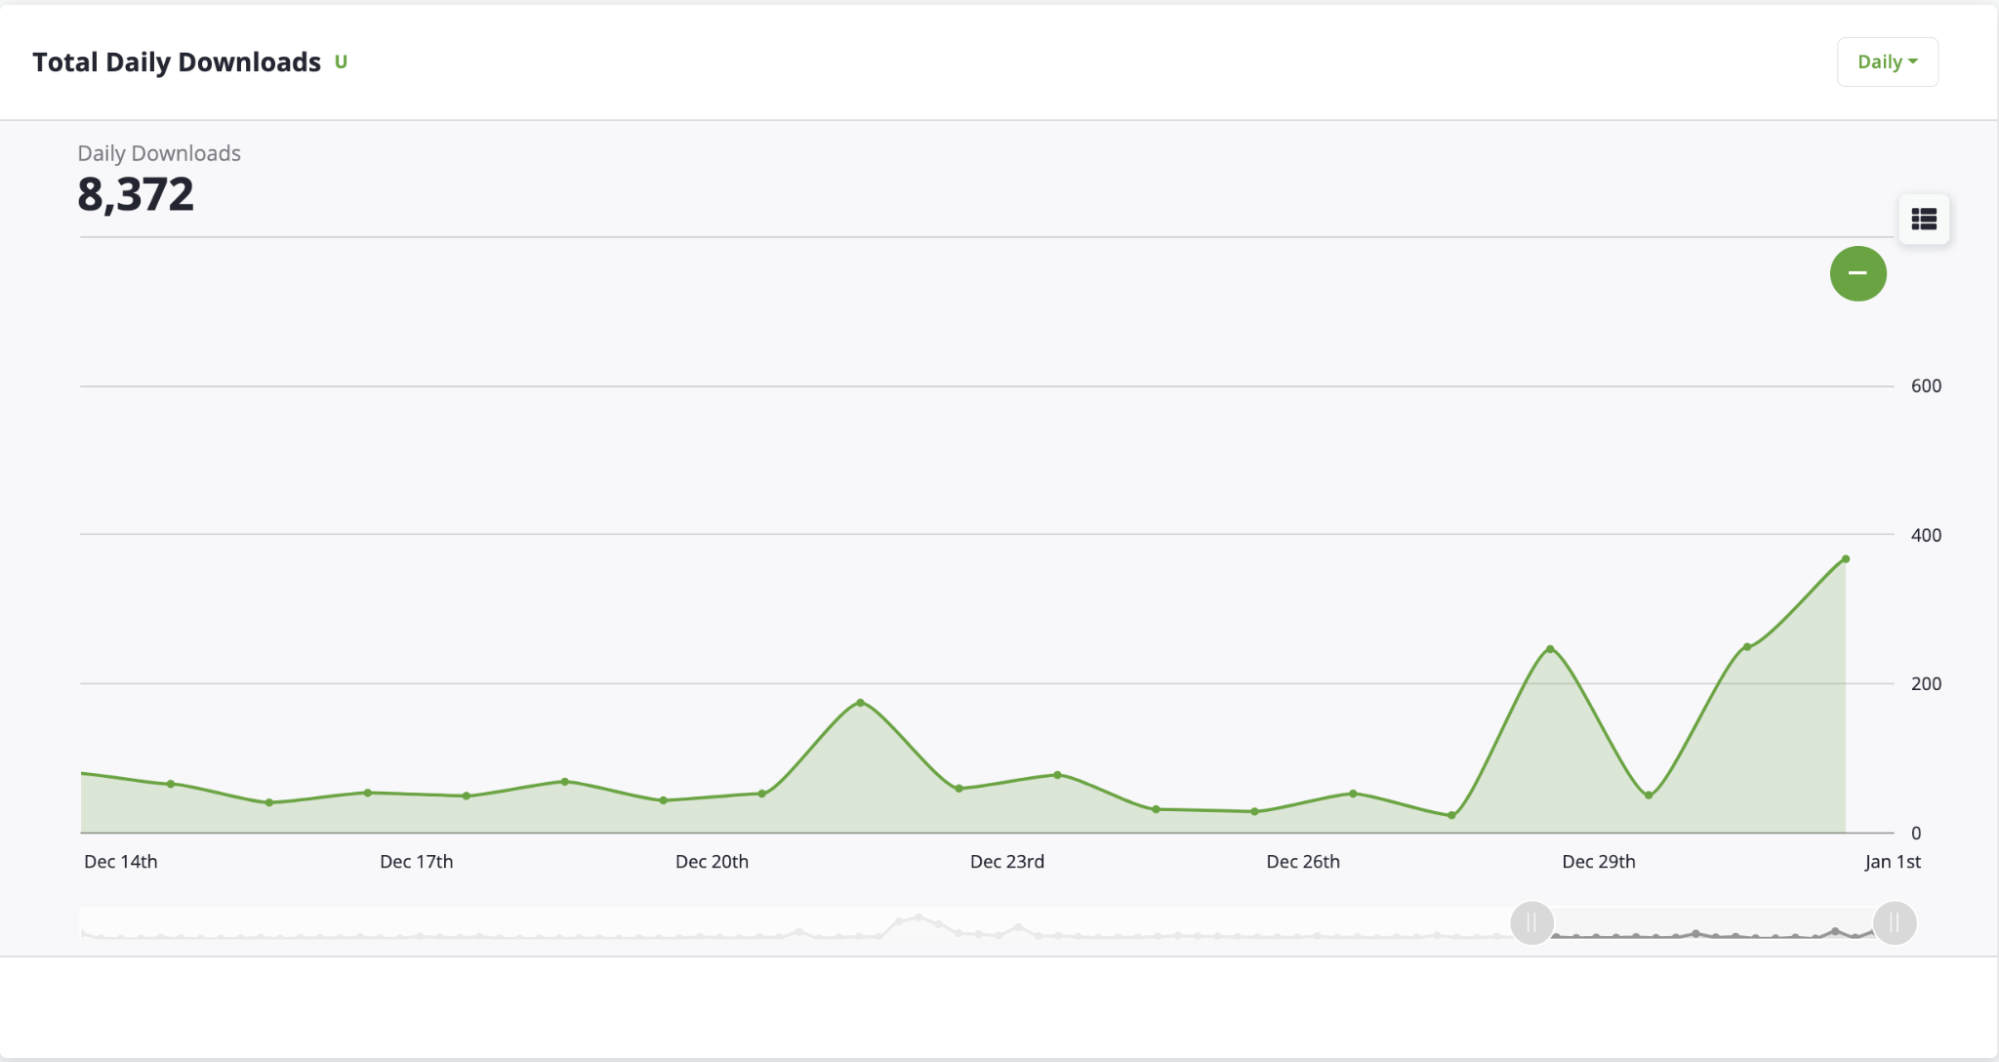
Thankfully, a flagship podcast is the gift that keeps on giving. The show still garnered 8,372 episodes this quarter, continuing to help us offer educational resources to our audience.
The Empire Flippers podcast feed occasionally gets new life when we post episodes from the Opportunity podcast. We used this feed to cross promote Greg Elfrink’s interview on the supply chain crisis, which unsurprisingly went on to be the top episode of the quarter for the show.
Here are the top three most listened to episodes for the quarter:
The Real Money Real Business Podcast
A decent number of readers of this report have likely been featured on the Real Money Real Business podcast (RMRB).
RMRB features interviews of sellers actively selling their business on our marketplace. We meet them to learn more about their business as well as the advice, lessons, and strategies they’ve learned along the way.
The podcast is an opportunity for a seller to share more about their business and answer questions about their journey that they rarely get the chance to disclose. They also have a chance to share their story to potential buyers, as we use the interview as another tool to market their business to our buyer base.
RMRB leads the pack for podcast downloads, coming in at 27,377 downloads for the quarter.
This podcast remains popular because it provides highly relevant insight to sellers and buyers at all levels. Because most sellers listing with us have the chance to be featured in a seller interview, RMRB episodes are often published several times a week. Relevance and volume of episodes published help boost the final download tally for the quarter.

Here are our top three most listened-to episodes for the quarter:
- RMRB 466 – Buying and Growing an $800K Website Without Adding Any Content
- RMRB 456 – Pulling Information From Reddit to Start a Profitable Content Site
- RMRB 454 – Turning a Passion Project Into a Profitable Content Site
The Opportunity Podcast
The Opportunity podcast celebrated its first birthday this quarter.
Starting from scratch on a new show has been a learning experience. The success of the Empire Flippers podcast is easy to take for granted. Despite being released irregularly, it benefits from a history of being popular and still attracts downloads from a loyal audience.
Restarting the podcast development journey meant relearning the ropes in an updated podcasting environment, without well-known founder personalities to head the show.
Thankfully, having the audience that we do meant that we could plug into a base eager to get more audio insight around online M&A. We also benefited from connections in the industry that were happy to come on the new podcast with us.
We first developed the style of the show and planned what we wanted to offer. What started out as a way to capture buyer stories on our marketplace evolved into capturing expert insights all across the online business space. We featured SEOs, affiliate marketers, PPC experts, YouTube channel buyers, and a special panel feature of a leading aggregator and buyer from our marketplace.
Now the show seems to have its own stride. We can attract great guests simply by word of mouth, and thanks to adding a podcast producer to the team, we’ve been able to book more guests on the show than ever before.

Top episodes for the Opportunity podcast in Q4 2021:
- How to Buy an Established YouTube Channel and 10x Its Revenue With Sushee Nzeutem
- The Top SEO Practices That Can Radically Transform Your Business with Andrea Barnhill
- Ecommerce Entrepreneurship: How to Scale Your Online Business Successfully with Ronnie Teja
Email and Contacts
In the months leading up to Q4 2021, we were deep in research on all things newsletters.
We had aspired to create a comprehensive newsletter surrounding online business M&A and to launch it in Q4. Accordingly, our refreshed Friday newsletter, This Week in M&A, was born.
One of the most rewarding aspects of the newsletter was hearing positive feedback at launch and throughout the growing phase of the newsletter. Readers seem excited to receive a newsletter aligned with their interests in online M&A for the first time.
The positive feedback is much appreciated, but what could arguably be even better is receiving reader feedback for changes and improvements.
We offer a chance to give us feedback on what readers liked and did not like at the bottom of every newsletter. Directly hearing from our audience each week on what could be improved has been immensely helpful. Every submission is read and evaluated, and we use the feedback to quickly implement changes and new ideas.
Opening the floor to the audience to give them the opportunity to ask for the newsletter they want to see has allowed us to grow our engagement. It creates a democratic environment to better our content from week to week.
For those looking to build their own newsletter from scratch—let your audience curate your materials early on; you create a dialogue and thus a community.
If you haven’t already, you can subscribe here for This Week in M&A.
As for our email, we are happy to report a steady increase on trend with past growth. Because email is the lifeblood of our marketing strategy, this progressive climb is great news.
Each week we add subscribers to our list. Our focus on recurring organic traffic and on consistently putting out content to rank on Google helps us keep the inflow of new subscribers fairly consistent.

Email is our chance to nurture our audience at every step of their journey with us. When someone subscribes by registering for a free marketplace account, filling out the valuation tool, or submitting their business for sale, our email marketing workflows guide them through the step of necessary information or the content that fits their needs.
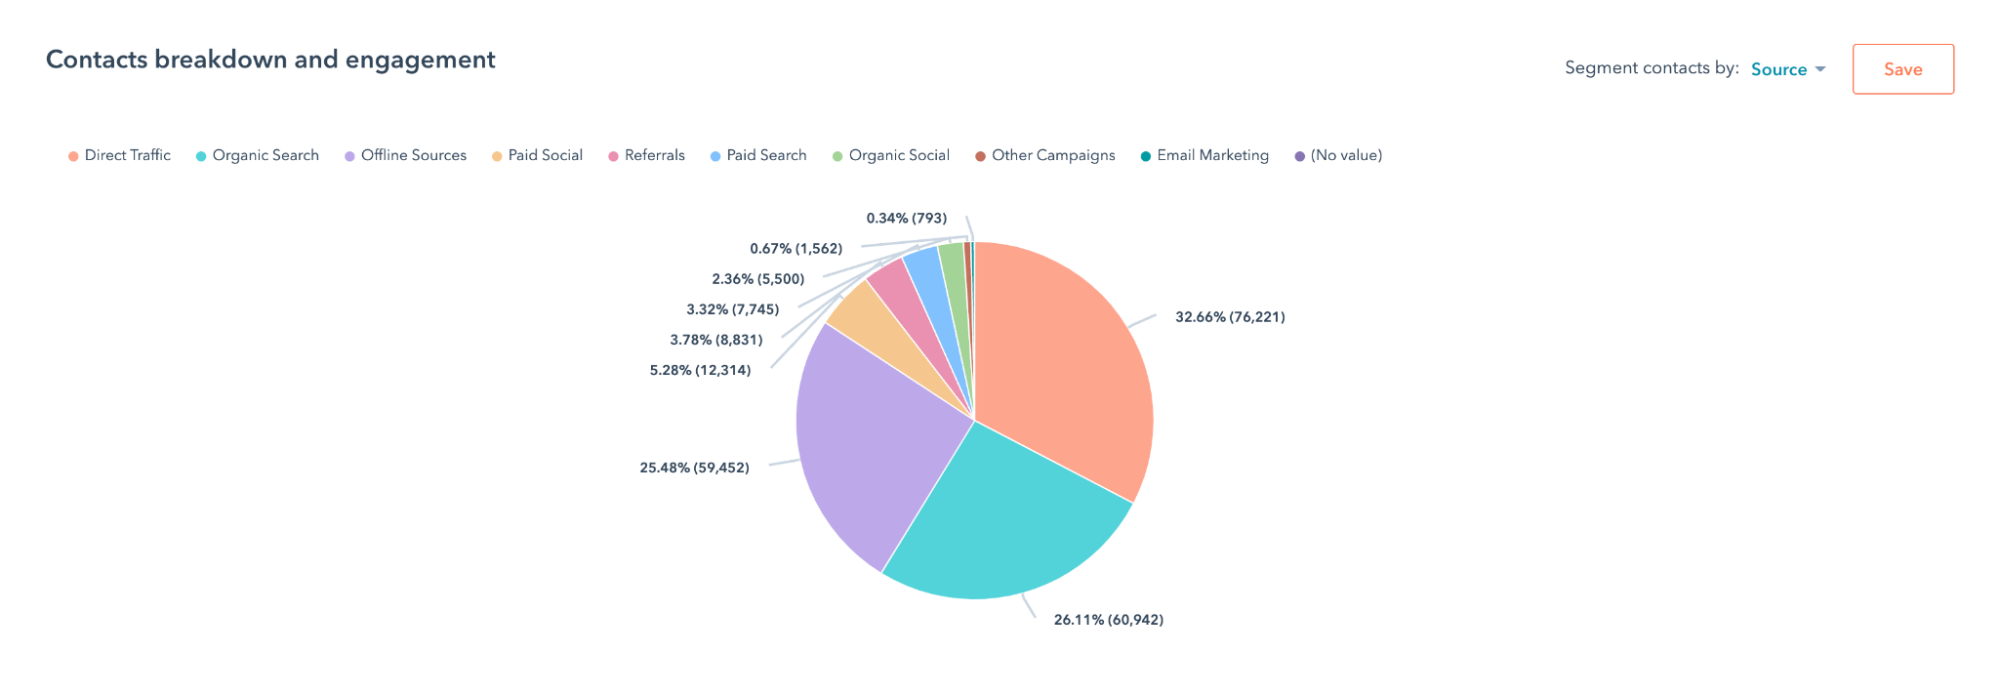
Let’s understand where our contacts came in from.
Attribution has always been slightly tricky for us.
We have a long sales cycle as well as a wide presence across the industry. When you are constantly on podcasts, webinars, and conferences like we are, knowing exactly where someone first found us is sometimes more of an art than a science.
This shows up in our high percentages of offline marketing and direct source attributed contacts. This is the more official, jargon way of Hubspot saying, “I know kind of where they came in but I can’t exactly tell you from where.”
More comforting, however, is seeing organic still play a significant role in our contacts engagement. We can breathe a sigh of relief seeing the direct results of our SEO efforts.
Our other campaigns, often highly targeted toward certain segments of our audience, continue to bring in a large percentage of our contacts as well. Our goal is to be as efficient as possible with the email we send out; this has led to positive engagement over the years.
What Happened Across Departments in Q4 of 2021?
Engines were humming across the company in Q4. Here are the updates from our teams on what happened as the year closed out.
Engineering
Our marketplace and everything it encompasses is all thanks to our strong engineering team.
Without them, we wouldn’t be able to maintain the industry-leading customer experience and sales process that we pride ourselves on.
They built the framework to make deals seamless online and are constantly iterating on that framework to make it better. If you want to nerd out on all the developments, you can check out our changelog.
One area of focus for Q4 was user experience. Engineering facilitated a UX audit and partnered with an award-winning design and CRO agency to make updates throughout our marketplace. We anticipate that updating our overall user experience online will have a ripple effect across our customer service and sales teams in particular.
We brought one new hire to the engineering team in Q4 and currently have open engineering positions. We still aim for bigger and better features in the coming years for the marketplace, so finding the right engineers to implement that vision will be key for our engineering team.
Migrations
Migrations truly set us apart in the brokerage industry. They’re the finishing touch on our entire deal process and are oftentimes the most critical step in a seller and buyer’s journey. After all, you can’t buy or sell a business if it cannot properly be transferred between owners.
Our migrations team is small but a powerhouse. They completed a total of 72 migrations for the quarter with an average of 34 days per migration: for clarification, the duration is from the business sold date to the seller being paid out.
About a month to have the entirety of your business legally handed over to the buyer and have cash in hand is impressive. Moreover, the retention of those migrations stands high, as only two deals (<5%) were reversed at the migration stage.
Attached is a breakdown by business model of what was migrated during Q4 2021.

Customer Service
The numbers for Q4 show that customer service was able to tackle a dizzying volume of customer support needs.
Our team fielded 3,216 support tickets and facilitated 1,105 chats with customers looking for information and help on our marketplace. They dealt with the influx of proof of liquidity that has steadily grown to over $6 billion for our buyer pool. They verified 1,131 proof of funds documents, which took an average of 10.67 hours to get approved or rejected.
Regarding onboarding new users to our marketplace, our customer service team helped add 8,841 new users and dealt with 2,119 ID verifications. They also helped oversee the 7,636 unlocks of listings in Q4 alone.
EF Capital
Empire Flippers Capital has continued to gain momentum and if Q4 was any indication, that will not be slowing down anytime soon.
Q4 2021 was an exciting time for EF Capital as the program approached the one year anniversary of the Round 1 launch. Over the course of last year EF Capital raised $13MM for 8 operators. Round 1 businesses really began to see their growth strategies pay off, providing investors with excellent cash on cash returns on their investments. At the same time, Round 2 funding was completed with 4 operators receiving funding totaling over $6MM.
So how did Round 1 perform?
Round 1’s businesses were in the Content and Amazon FBA monetizations. Q4 2021 was the first full quarter of results following the acquisition and migration periods. Following Q4 investors received a 5% cash on cash return and net income across all sites is up 22% since acquisition. In EF cap’s return projections, base case results had businesses up 12%, and after only one full quarter they are up 22%.
If you are interested in participating in this Round or future Rounds, fill out the investor interest form here. If you have a track record of growing online businesses and are interested in being a future operator please fill out the operator interest form here.
Vetting
Getting caught up in the volume of businesses sold for the quarter is easy (82 in total). Moreover, it is easy to forget that for every business sold, there would be more listed businesses and even more who tried to list but got weeded out by vetting.
Vetting is the whole reason we can call ourselves a curated marketplace. The vetting team was hard at work in Q4 handling an influx of sellers hoping to exit before the year end and sorting through those who would and wouldn’t be a good fit to sell with us.
The vetting team listed 183 businesses totaling $115,495,584 in value. On average, they listed 14 businesses a week, with some weeks having as high as 20+ listings.
Probably the most impressive feather in their cap is their listing of 25 seven-figure deals. The larger the business, the more tedious it is to vet.
This number was only possible to achieve owing to a solid system the vetting team has in place to vet these businesses in a timely manner and the talented specialists who understand the nuances to look for in multi-million dollar businesses.
Sales
The sales team has been focused on processes and on refining the system that allows them to give streamlined, top of the industry service to sellers and buyers.
They built their outbound team and hired members to help cater to the growing number of seven-figure sellers on our marketplace and to improve their overall efficiency as a team.
Another exciting area of growth for the sales team was growing partnerships with funding partners for buyers. Opportunities for buyers to secure funding outside of traditional, strict methods such as banks or through capital raising are growing, and the sales team worked to provide more funding options for our buyer base.
Note that the sales team also closed two eight-figure deals for $12M and $11.8M.
Not a bad way to close out the year, right?
Financial
Our financial team grew in a very important way for our entire company. We brought on a new director of finance to review processes and improve operational efficiency.
The finance team’s first area to tackle regarding efficiency had to do with how we pay out our customers.
They looked to streamline existing manual processes to more efficiently pay out sellers and buyers in a timely fashion. This becomes all the more important as we scale our volume of deals and the size of businesses sold.
Looking Back and Looking Forward
And with a deep exhale, that’s a wrap on our Q4 2021.
2022 already looks like it is going to be an interesting year, so stay tuned for future updates! You know we love data, so we will be back soon with all the interesting data from the start of the new year.
If this report has left you thinking about making an exit, click here.
If you’d like to buy a profitable business, click here.

