2021 Q3 Report – July, August, September
 Updated on January 27, 2025

It’s that time again – where we run through our numbers for the previous quarter.
There’s been a ton of developments, milestones achieved, company growth, and more throughout Q3 2021.
Again, we saw the biggest quarter on record and, as of this writing, there are signs that Q4 2021 will be even bigger.
Every quarter, we produce this report as a commitment to our core value of transparency. While there have been a number of successes this quarter, the intention isn’t to brag. Rather, we do this because when we were first starting out, we wished there were more people writing up reports about their journey to help inspire us along our way.
This report is really for you.
We hope that by showing you some of the successes (and failures) in our own business that it will help you plan and roadmap your way towards success.
Of course, if you’re ready to make an exit, we’re also here to help you sell your business and collect all that hard-won equity you’ve built.
As always, we’re going to start by diving deep into our actual marketplace financials, and then we’ll discuss our traffic channels to identify what worked and what didn’t. We’ll finish by talking about the events or major milestones that happened in Q3.
Executive Summary: Q3 2021 Report
Q3 2021 Business Data
Business Data
Total team members:
- Founders: 2
- Sales team members: 19
- Marketing team members: 12
- Operations team members: 32
- Engineering team members: 9
- Human resources team members: 1
- Finance team members: 2
- Contractors: 2
Email subscribers: 133,628
Podcast downloads: 47,833
Site visits: 252,814
Revenue:
Brokered site sales: $36,201,468.22
Additional/other revenue: $26.68
Average deal size: $411,380.32
Total revenue: $36,201,494.90
Earnings:
Brokered site earnings: $3,452,716.73
Earn-out payments: $277,985.50
Additional revenue: $0
Adjusted from prior quarter: -$6,750
Total gross earnings: $3,723,952.23
Businesses for Sale Right Now: 27 7+ Figure Listings
Q3 saw our marketplace boom with businesses in the seven-figure plus range.
Of course, you don’t need this list to tell you that.
When you sign up for a free Empire Flippers marketplace account, you’ll have the ability to filter our marketplace by price range to fit whatever your budget is, plus a bunch of other industry-first features that we’ve designed to make your deal-finding job easier.
Here’s a list of all the current seven-figure listings we have for sale in the marketplace:
- Listing #56827: An Amazon FBA and eCommerce business created in December 2015 in the sports and health & fitness niches. The included Amazon Seller Central account features 760+ SKUs under 10 different brands, five of which are trademarked and registered with Amazon’s Brand Registry 2.0 for branded sports and fitness products. This business is valued at $12,628,097.
- Listing #56714: A display advertising business created in March 2020 in the social media niche. The WordPress site aggregates viral content from social media and drives traffic through a network of Facebook pages. This business is valued at $8,108,979.
- Listing #56654: An Amazon FBA business created in August 2018 in the children niche. The included Amazon Seller Central account features 35 SKUs for a variety of children’s toys and is part of Amazon Brand Registry 2.0. This business is valued at $5,637,888.
- Listing #55929: An eCommerce and display advertising business created in July 2016 in the home niche. The included Shopify and eBay storefronts feature high-end home furniture items that are manufactured in Italy and England. This business is valued at $5,428,223.
- Listing #56738: An SaaS and subscription business created in December 2016 in the SEO niche. Built on Django, the platform helps to increase website clicks for SEO purposes. This business is valued at $4,815,482.
- Listing #55325: An Amazon FBA business created in July 2014 in the kitchenware niche. The included Amazon Seller Central account features 58 products spread across 100 SKUs (61 SKUs in the US and 39 SKUs in Canada) for items used in the home. This business is valued at $4,374,436.
- Listing #57039: An affiliate, Amazon Associates, and display advertising business created in December 2013 in the digital media niche. The WordPress site features buying guides, courses, and information around a specific hobby and profession. This business is valued at $4,292,420.
- Listing #49202: An eCommerce and Amazon FBA business created in May 2014 in the beauty niche. The business includes 2 Shopify storefronts, an Amazon Seller Central account with 3 SKUs, an email list with over 10,000 contacts, a trademark, and is a part of Amazon Brand Registry 2.0. This business is valued at $4,209,434.
- Listing #53335: An Amazon FBA, eCommerce, and wholesale business created in August 2010 in the home niche. The included Amazon Seller Central account features 98 SKUs for a hygiene product as well as some other home products. This business is valued at $3,309,777.
- Listing #56320: A digital product business created in March 2016 in the information and automotive niches. The business is built on Wix and Teachable and sells online courses that teach students how to enter a specific career. This business is valued at $2,809,793.
- Listing #50455: An affiliate business created in November 2014 in the technology niche. Included in the sale are 37 domains for websites in 19 different languages that offer news, reviews, and buying guides for a wide variety of gadgets, hardware, and software. This business is valued at $2,547,405.
- Listing #55851: An Amazon FBA and eCommerce business created in April 2017 in the beauty niche. This business includes two trademarked brands across two Amazon Seller Central accounts that are both on Amazon Brand Registry 2.0 and features 118 SKUs focusing on a specific type of beauty product. This business is valued at $1,859,459.
- Listing #51935: A SaaS business created in October 2015 in the sports niche. The PHP and MYSQL platform provides analytics for various sports fans and is monetized through subscriptions. This business is valued at $1,762,368.
- Listing #53295: An eCommerce business created in January 2019 in the electric mobility niche. The Wix store specializes in high-value electric mobility and transport products and accessories with its own brand and designs. This business is valued at $1,688,126.
- Listing #55732: A display advertising business created in January 2012 in the health & fitness niche. Included with the business are 2 WordPress sites featuring articles and advice about health, nutrition, diets, and fitness. This business is valued at $1,681,884.
- Listing #55849: An Amazon FBA and eCommerce business created in February 2019 in the supplements niche. The trademarked brand is registered with Amazon Brand Registry 2.0 and has 45 total SKUs related to a mainstream diet. This business is valued at $1,611,868.
- Listing #57293: An Amazon KDP and Merch business created in May 2018 in the books niche. There are 982 books, 24 eBooks, and 7 audiobooks across 494 pen names covering a range of topics. This business is valued at $1,558,842.
- Listing #55453: A display advertising and affiliate business created in April 2017 in the travel niche. The WordPress site features travel-related news and guides. This business is valued at $1,538,083.
- Listing #56985: An Amazon FBA business created in June 2016 in the outdoors niche. The included Amazon Seller Central account features 40+ SKUs for a product used for weather protection. This business is valued at $1,432,204.
- Listing #48901: A subscription and dropshipping business created in January 2018 in the art niche. Revenue is generated primarily through a popular and growing subscription-box service and supported by two related Shopify stores all operating in the arts & crafts niche. This business is valued at $1,355,079.
- Listing #56107: A display advertising, affiliate, and Amazon Associates business created in September 2013 in the home, outdoors, and lifestyle niches. The WordPress site features information related to alternative lifestyles and travel, with a small percentage of review-style articles. This business is valued at $1,326,078.
- Listing #57427: An Amazon FBA business created in September 2015 in the tobacco accessories niche. The included Amazon Seller Central account features 79 SKUs for smoking-related products under four different brands, all of which are trademarked and registered with Amazon’s Brand Registry 2.0. This business is valued at $1,214,565.
- Listing #55257: A display advertising, Amazon Associates, and affiliate business created in October 2017 in the travel niche. The WordPress site features informational articles and best-of guides around outdoor living. This business is valued at $1,113,497.
- Listing #50297: A DropShipping, Amazon Associates, and display advertising business created in October 2016 in the outdoors niche. The WooCommerce-powered site features product information and reviews for popular outdoor equipment and tools. This business is valued at $1,110,625.
- Listing #54968: A SaaS business created in July 2020 in the business niche. The software helps marketers in any language find and offer their services to businesses that could benefit from gaining more online clients. This business is valued at $1,030,158.
- Listing #57278: An Amazon KDP and ACX business created in October 2015 in the parenting, lifestyle, and books niches. The business includes 1,800+ eBooks and paperbacks, and 224 audiobooks for content related to paranormal fiction, self-help, and parenting topics. This business is valued at $1,025,682.
- Listing #54351: A 2-application package subscription business created in September 2018 in the gaming and quizzes niches. The apps have around 1.6 million total downloads and around 4,300 subscribers. This business is valued at $1,010,831.
For buyers looking to acquire their first digital asset, it’s never been a better time to find a plethora of high-quality deals to add to your portfolio. If you’re a first-time buyer or just a buyer wishing to get some initial advice before making a purchase, click here to schedule a call with us.
Revenue Breakdown
Brokered Site Revenue
In Q3 2021, we sold $36,201,468.22 in brokeed businesses on our marketplace. This is down a fair amount from Q2 where we had $47,154,576.70 in sales. While that feels like a steep drop, this is still a huge number.
A portion of the decline in revenue could be attributed to the current supply chain crisis being weathered by eCommerce entrepreneurs right now. Still, it is not incredibly concerning as new aggregators come online and old aggregators raise large, fresh rounds of funding. As of this writing, there have never been more unicorns in our space going to the market to acquire high-quality brands.
It is likely we will see some depressed earnings from the supply chain crisis, as it is expected to last for several more months, which could be concerning for entrepreneurs who decide to hold onto their business rather than selling the asset during this hot seller’s market. As far as the aggregators go in the Amazon FBA space in particular, they will likely weather the storm and continue to buy Amazon FBA brands, as many of them are cash heavy.
You can see the dramatic difference in our earnings from Q2 to Q3 in the chart below.
Below is a breakdown of our quarter-by-quarter growth:

That dip looks scary, but as always when you’re selling low-quantity high-ticket items like our M&A firm does, you’re going to get some lumpy graphs from time to time. Sometimes a slew of big businesses sell off at once, creating big jumps in the graphs, and the next month you start back at a revenue of zero.
If we zoom out and look at our marketplace overall, you can see that our company’s growth is still very healthy. It paints a much less bumpy picture and one of continued dominance in the space.
Here’s a look at our overall marketplace sales:

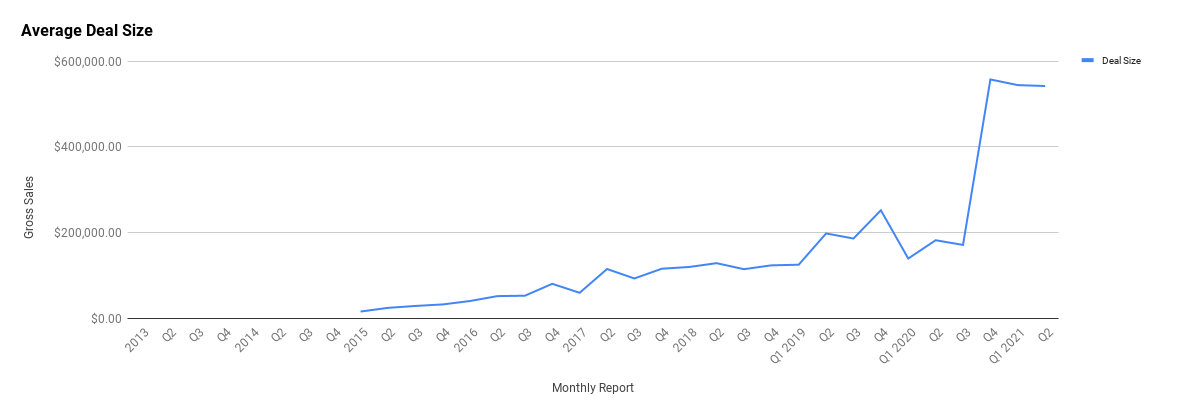
Our average deal size remains high in Q3 at $411,380.32, which is down a bit Q2’s $542,006.46. This again goes back to the “lumpiness” of running a brokerage like ours where one day we might sell a slew of $100k businesses and another day sell a single nine-figure business.
Overall, our average deal size remains incredibly high, and there’s no reason to think we can’t go even higher. As you can see in the graph below, we’ve reached a bit of a plateau when it comes to average deal size.
We predict that we will likely break through this plateau in the next year.
The reason?
In 2021, we sold the first eight-figure business on our marketplace. Right now, we’ve only sold a handful of these, but if historical precedence is taken into account, they’re going to become a lot more common on our marketplace.
Whenever you reach a new pricing threshold as a marketplace, you run into a chicken and egg problem. High-level sellers want to use you but not until they’ve seen others use you, and buyers for those assets may not be there until you have the actual asset for sale. This has always been a problem we’ve had to solve at each valuation threshold we’ve sold.
Usually the issue resolves itself once an entrepreneur who knows our reputation decides to be first. That first deal often takes the longest to sell as we learn how to negotiate and structure the deal. Afterwards, however, it is like a dam breaking; more high-valuation sellers in the new price threshold come out to sell with us, which in turn increases the size of the network of buyers with the appetite to purchase these businesses.
It is very likely this will happen again in the $10 million+ valuation range, which will result in seeing our average deal size shoot up significantly once again.
Here is how our average deal size in the marketplace has changed over time:
While all this revenue is great, it’s important to remember that we only take home a certain portion of that revenue for ourselves. In Q3, our gross earnings was $3,452,716.73, which is lower than Q2’s $4,101,403.95 but higher than Q1’s $3,318,810.11.
This is especially interesting because Q1 and Q2 both had similar levels of revenue. So why did Q3 have such higher profit with lower revenue?
A portion of that is a result of us continuing to become more efficient in our processes, team, and grow our brand’s dominance in the space.
One of the biggest reasons is the continuous growth of our earn-out payments. As we broker bigger deals, the deal structures become more complex, which results in having larger ongoing payouts from either stabilization payments or earn outs or both.
Unlike other brokers, our M&A firm manages these on-going deals on behalf of our sellers once they’ve made their exit. This aligns us with the seller because we don’t take the full commission from the sales price until the earn out is completed and the seller is fully paid.
This means we’d never recommend a seller to take a deal unless we had confidence it would go through. After all, we want to get paid too!
Tracking earnout payments for these quarterly reports is still relatively new to us. In Q3, we had $277,985.50 in gross earnings just from earn outs. As of now, Q3 2021 remains our biggest quarter since we started tracking earn outs for these reports.
For comparison, in Q2 we had $144,772.37 in earnout payments.
We expect this section of the business to continue to grow so much that our migrations team has decided to hire a dedicated person to manage the variety of deal structures we help our sellers negotiate.
The financial numbers for us look healthy with an even brighter future, but how did our traffic and marketing hold up in Q3?
Let’s dive into it.
Traffic and Audience
Blog Traffic and Analytics
Our blog and website remain our workhorses when it comes to driving traffic and revenue.
In Q3 and as of now in Q4, several of our content pieces have gained traffic not just from traditional SEO, but also from being shared in business-buying groups and newsletters such as Investing.io.
While SEO traffic remained as strong as ever, there was less of a focus on SEO-driven content. Instead, we proactively focused on creating content pieces that may not inherently have SEO value in terms of keyword volume but do resonate with our audience.
As time goes on, we are more and more focused on making every piece of our marketing a value-add to the end user. This applies to everything from blog posts to ads. If we can make even a Facebook ad have value to our audience without them ever having to click the ad, then that’s a win because it helps us build a better relationship between our audience and brand.
This is all part of our general philosophy. We want to use marketing like a media company whose goal is to educate and entertain rather than directly sell people on using services. Of course, we will jokingly hard-sell you, as I talked about in a podcast we recently put out about the looming eCommerce supply chain crisis.
Here’s the data on our traffic for Q3:

Here are our top referring channels:

Here are our three most viewed pages:
Here are our three most viewed listings:
- Listing #54240 (SOLD!): This listing is for an Amazon Associates and display advertising business created in February 2019 in the equipment niche. The WordPress site features content and product reviews for a tool primarily used on electronics. This business is valued at $24,002.
- Listing #49202: This listing is for an eCommerce and Amazon FBA business created in May 2014 in the beauty niche. The business includes 2 Shopify storefronts, an Amazon Seller Central account with 3 SKUs, an email list with over 10,000 contacts, a trademark, and is a part of Amazon Brand Registry 2.0. This business is valued at $4,209,434.
- Listing #54883 (SOLD!): This listing is for an Amazon FBA and eCommerce business created in October 2016 in the home and outdoors niches. The included Amazon Seller Central account features 202 SKUs (65 of which are backup FBM offers) predominantly for home cleaning products but also include products for home maintenance and gardening. The high-quality brand is registered with Amazon’s Brand Registry 2.0 and has trademarks in the US, EU, Mexico, Japan, and China. This business is valued at $9,437,210.
Here are our three most viewed pieces of content:
- How to Start an FBA Business
- 11 Best Affiliate Programs for Beginners to Make Money
- The SaaS Business Model Explained
Here are our three most viewed recent content pieces:
- 200+ Best Recurring Affiliate Programs for Every Niche
- How SaaS Valuations Work: Multiples, Metrics and MRR
- 46 Pet Affiliate Programs: Every Affiliate Offer You Need
In addition to everything above, we’re working on some truly exciting SEO projects that will likely start bearing fruit for us near the end of Q1 2022. We’ve started taking our first real steps into technical SEO, and we’re liking what we see as a large opportunity on both the buyer and seller side of our marketplace if the campaign works out.
Educational YouTube Channel
We are continuing to produce educational YouTube videos on our secondary channel.
This quarter, we also produced the most views in a single quarter and gained hundreds of new subscribers. We clocked in at 8,605 views for Q3 and an extra 313 subscribers to the channel.
Here’s our analytics snapshot for Q3:

So far, our general strategy with YouTube has been to approach our content creation from three main perspectives:
- SEO driven
- Browsing focused
- News or special updates
The general idea is to keep growing the channel’s long-term potential through solid SEO keyword research, optimizing for the keywords as much as we can, and, over time, this will grow our subscriber base and allow us to more easily drive traffic from the browsing-focused algorithm YouTube promotes.
The real monster amounts of traffic we want will come from this second engine. Growing our subscribers helps jumpstart this engine a bit faster as long as we keep producing videos that are valuable to the general business ecosystem on YouTube.
It’s a long-term game, but we’ve seen success with YouTube on several small fronts so far.
Below, you can see the strategy in action. The means of traffic generation for two of our top three videos were browsing focused, wherein we tried to appeal to people browsing YouTube’s homepage and other recommendation areas. The second most viewed video is one of our oldest and uses targeting keywords for rank, and this video is still driving many views for us almost a year after we finished promoting it.
Similar to podcasts, videos allow us to nurture a deeper relationship with our audience in a way that a blog post simply cannot. Though it is a lot of work to create a good system, we think that, in the long term, our YouTube channel can become a significant traffic source that converts people into either buying a business or selling a business with us.
Here are our top-viewed videos for Q3:
1. Explaining the Bolt On Wealth Strategy
2. Amazon Affiliate Marketing for Beginners – Learn What It Is and How It Works
3. The 8-Figure Media Company Business Model Part 1
Podcasts and Shows
Outside of our blog, podcasting remains one of our favorite ways to generate traffic, build our brand, and nurture our audience.
You’ll notice in this quarter that there is no mention of the Web Equity Show. While we still get downloads from the show, there are no foreseeable plans to bring it back at this point. Instead, we’ll be focusing on the main podcast properties we have.
The Empire Flippers Show
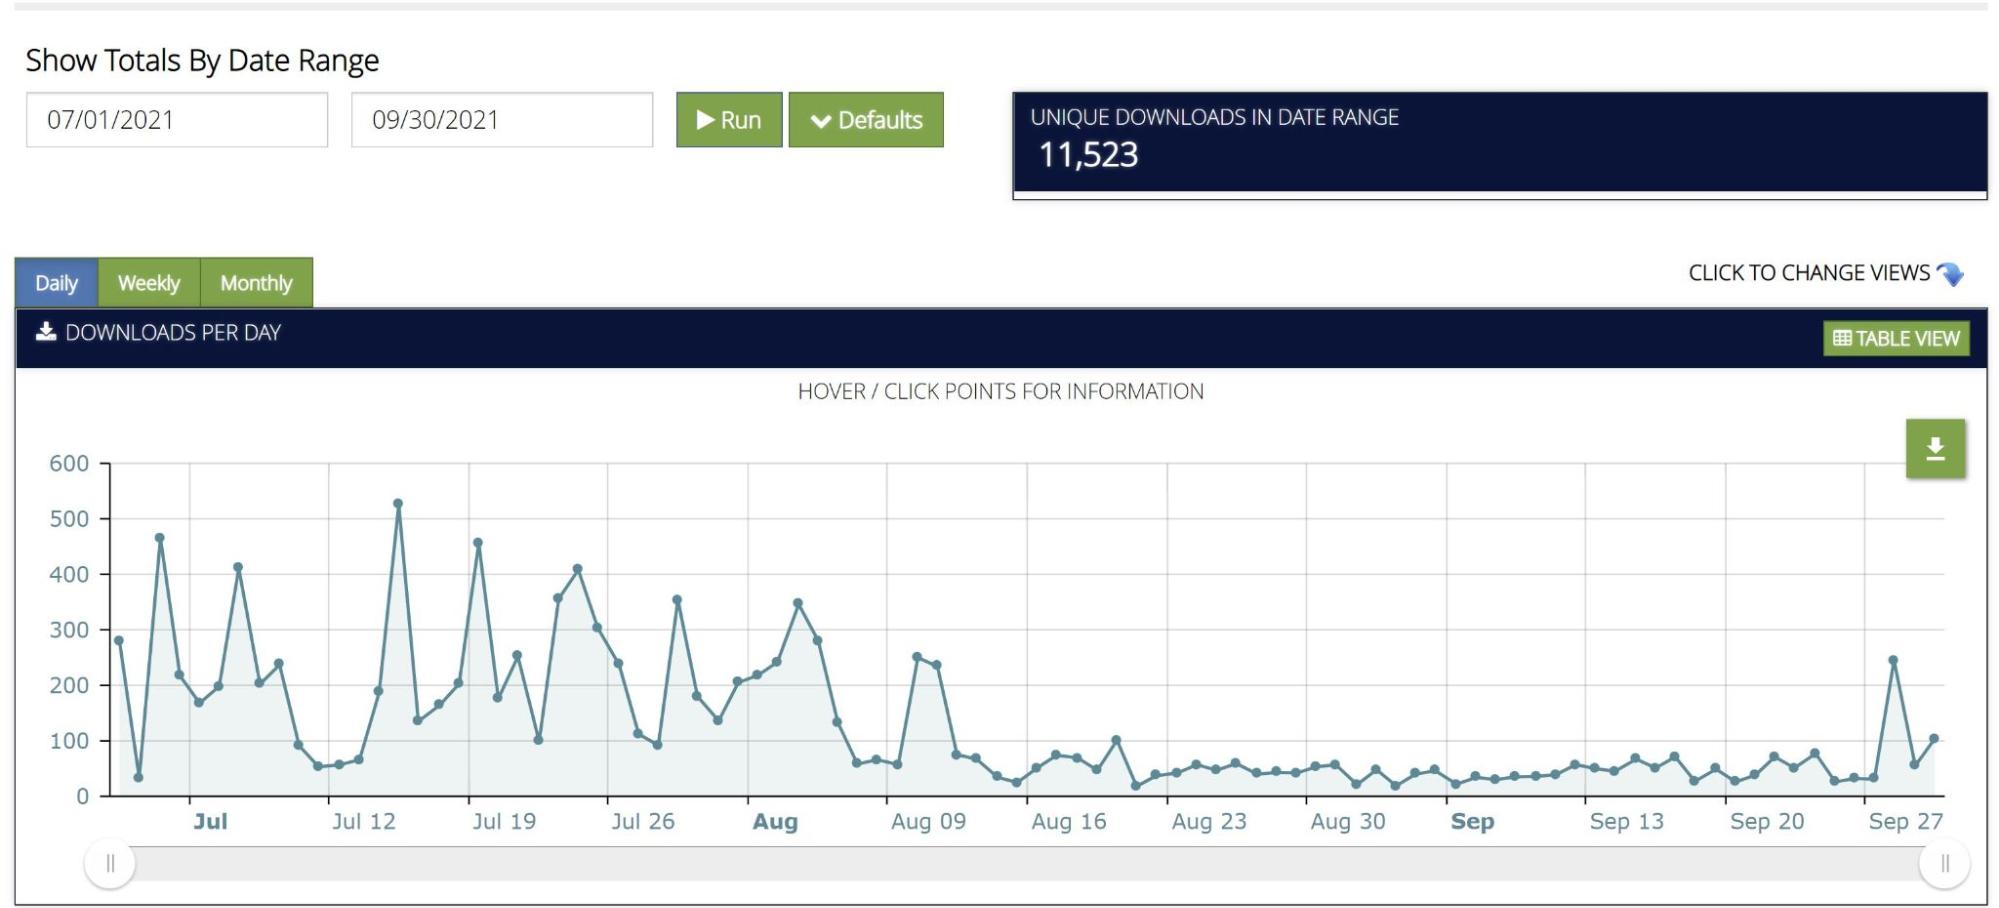
While nothing new has been published on the Empire Flippers Show in a long time, the show still generated 11,523 downloads, making it a testament of our style of marketing. Why do something that will only benefit you once when you can create content that performs on your behalf for years?
This podcast used to be our flagship show featuring our co-founders Justin Cooke and Joe Magnotti, who either discussed issues between themselves or brought on expert guests to interview.
The show itself hasn’t produced a new episode in a while, but we are considering using our access to a Libsyn feed to help promote our other show, The Opportunity.
Here’s the data on our downloads for Q3:
Here are the top three most listened to episodes for the quarter:
- EFP 212: Introducing EF Capital
- EFP 129: Dan Pena On Creating $50 Billion in Value
- EFP 210: Buyer Negotiation Tactics
Real Money Real Business (RMRB)
The RMRB Show is where we interview active sellers in our marketplace, discussing how they went about building the business and asking them to share their tips, strategies, and insights with the audience.
One of the most unique aspects of this show is the fact that we actually know these entrepreneurs have created a meaningful business. After all, we built their profit & loss statement.
The RMRB Show goes through spurts of publishing, as it is based purely on how many new live listings we’ve had in the marketplace. We aim to interview every seller who has built a business of a value over a certain threshold.
This show doesn’t just serve as a great (often daily) dose of inspiration for entrepreneurs, but it is also a way to promote the businesses we have for sale in the marketplace.
The old adage that people who know, like, and trust you are more likely to buy from you is never truer than in the M&A industry. These interviews give our sellers the opportunity to let buyers get to know who they are without the buyers themselves needing to go out of their way to do so.
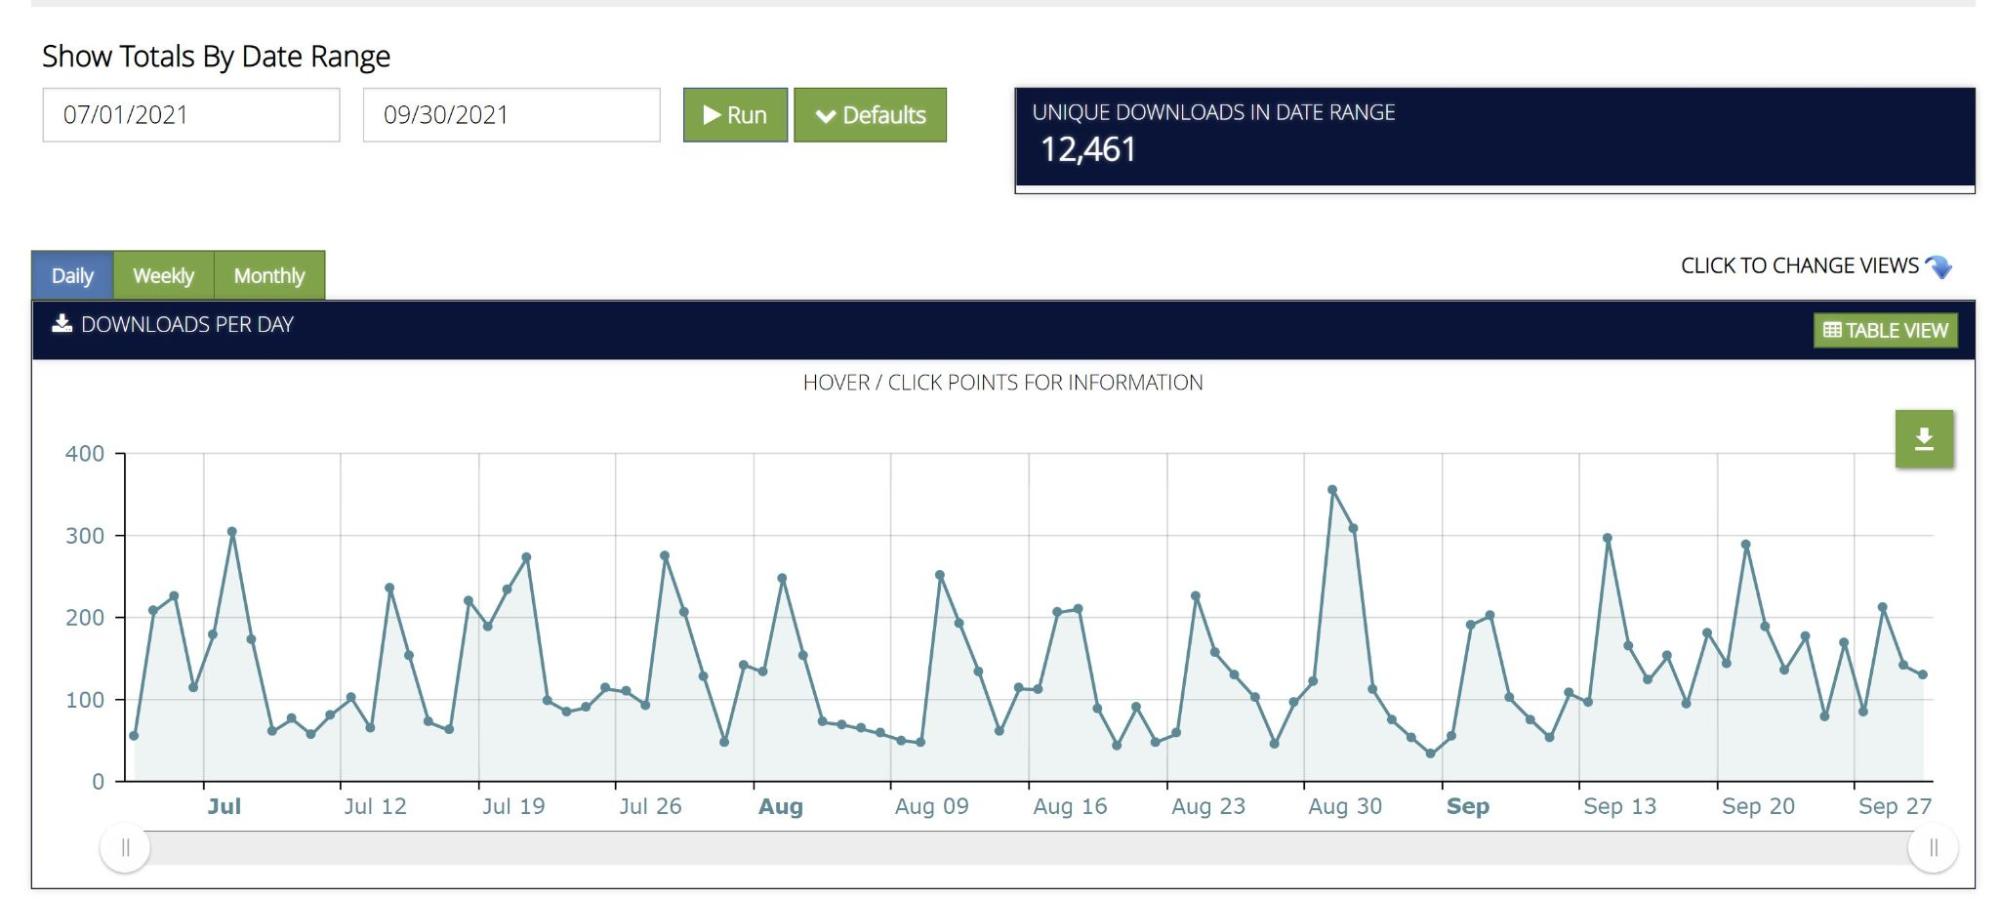
RMRB produced a whopping 23,849 downloads in Q3, making it our most downloadable podcast show. Of course, this is to be expected as we often publish multiple times per week due to the sheer volume of entrepreneurs going live on the marketplace that we can interview.
Here’s the data on our downloads for Q3:

Here are our top three most listened-to episodes for the quarter:
- RMRB 385: Running a Hands-Off Display Advertising Business in the Medical Niche
- RMRB 396: Generating $2.7K Profit Each Month on Amazon KDP
- RMRB 411: Creating Passive Income Through Amazon KDP
The Opportunity
The Opportunity continues to catch its stride, with its downloads this quarter outpacing the Empire Flippers show. For those not familiar, The Opportunity is a weekly podcast hosted by our content manager Sarah Nuttycombe where she interviews entrepreneurs and investors across the entire spectrum of the online M&A world.
We recently interviewed digital nomad Sushee, who said that by buying a YouTube business from us she was able to get her voice back, and we just interviewed our unicorn-level friends over at Thrasio in a buyer-seller roundtable discussion with the actual seller that sold his Amazon FBA business to them.
The Opportunity covers every level we see of entrepreneurs and investors alike, and we pass all that valuable education to our listeners for free every week.
Here’s the data on our downloads for Q3 2021:
Here are the top three most listened to episodes for the quarter:
- Scaling Your Content Business Using CRO [EP. 44]
- Building the Right SOP’s to Scale to Your Potential [EP. 45]
- Niche Site Experiments: Lessons Learned from Building My Portfolio with Shawna Newman [EP. 53]
Email and Contacts
Email remains our most powerful marketing channel.
Almost everything we do is meant to feed our email marketing automation. Once someone subscribes by registering for a free marketplace account, filling out the valuation tool, or simply submitting their business for sale, we try to help them get to the next logical step in their journey through our email marketing workflows and automations.
When you’re selling a high-ticket item like we are, you need to earn your audience’s trust. While content creation helps with this in a major way, the ability to stay connected to our audience via email is truly the glue that allows the trust between our brand and our audience to deepen.
To say that we take email seriously is an understatement. There is almost never a quarter that goes by in which we haven’t set some sort of email marketing goal to achieve.
You can see our contact growth from January 1st, 2020, to the end of Q3 in the chart below.
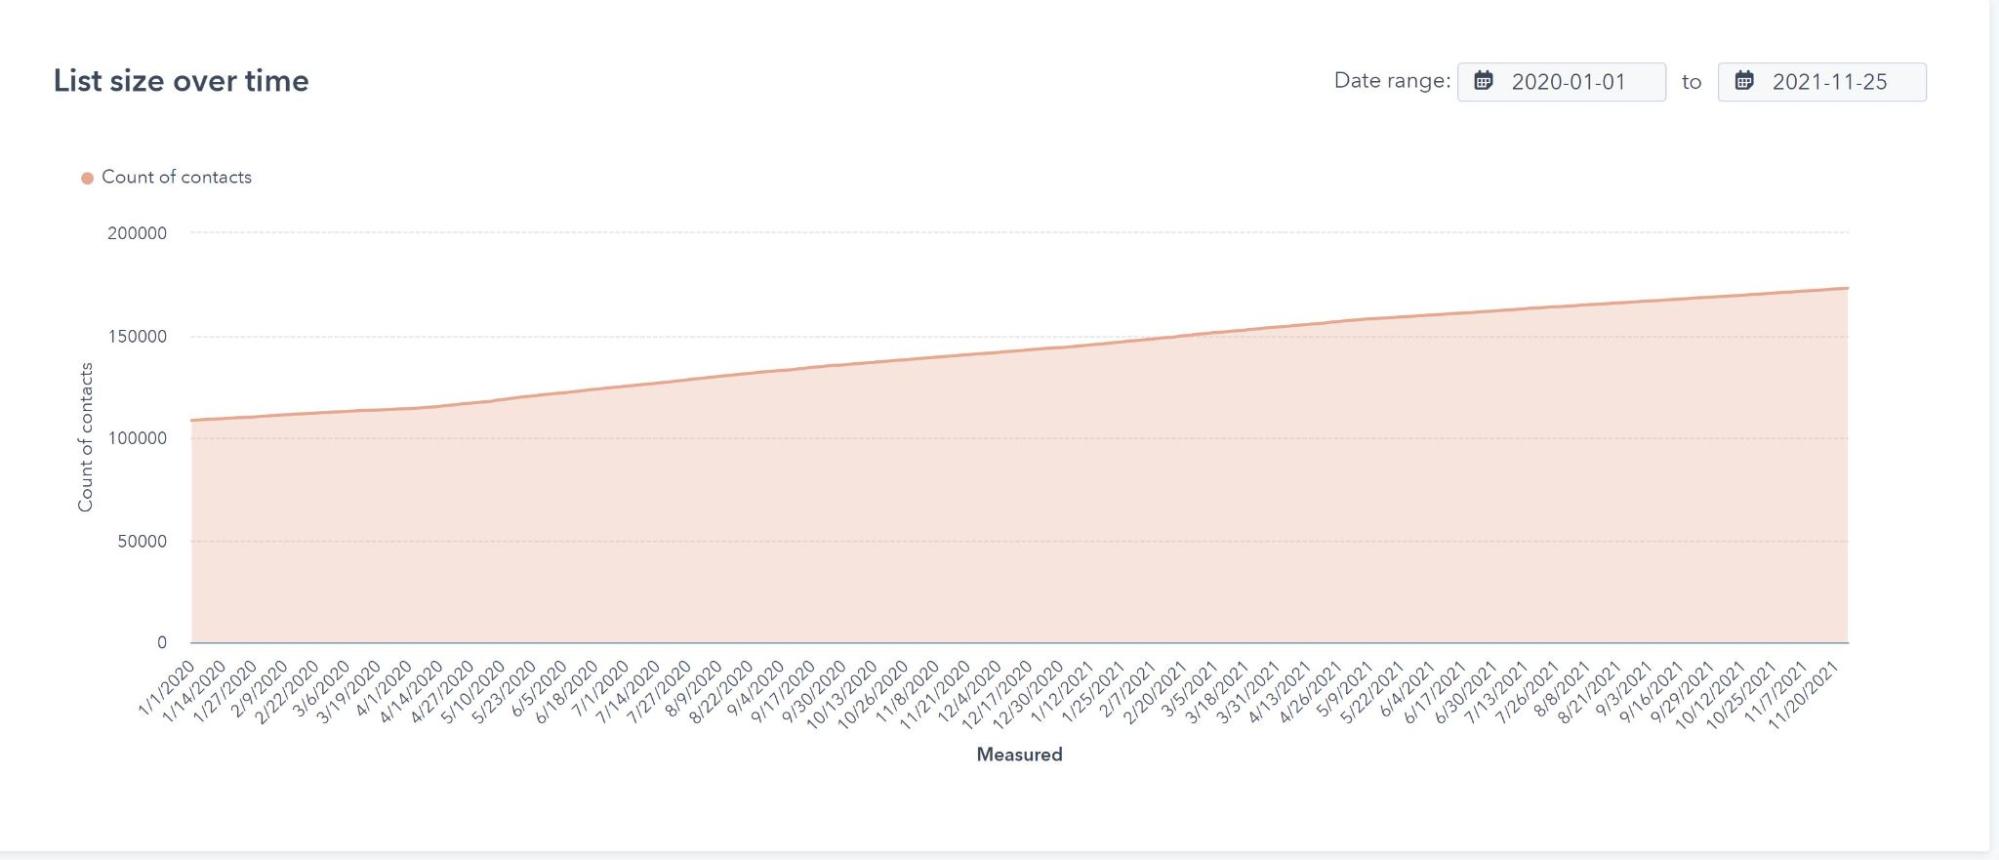
While the subscriber growth shown in the chart above may look trivial, it’s anything but; it actually represents our list growing by the thousands.
The reason the graph doesn’t look more dramatic is because we generally add a consistent level of new subscribers every week. A big reason for this is our focus on recurring organic traffic as the foundation of our traffic machine.
Unlike paid media, mediums like Google SEO provide a level of consistency that, barring algorithmic updates, tends to perform the same week in and week out with slight bumps of growth as new pieces of content start ranking on Google.
Contacts Breakdown:
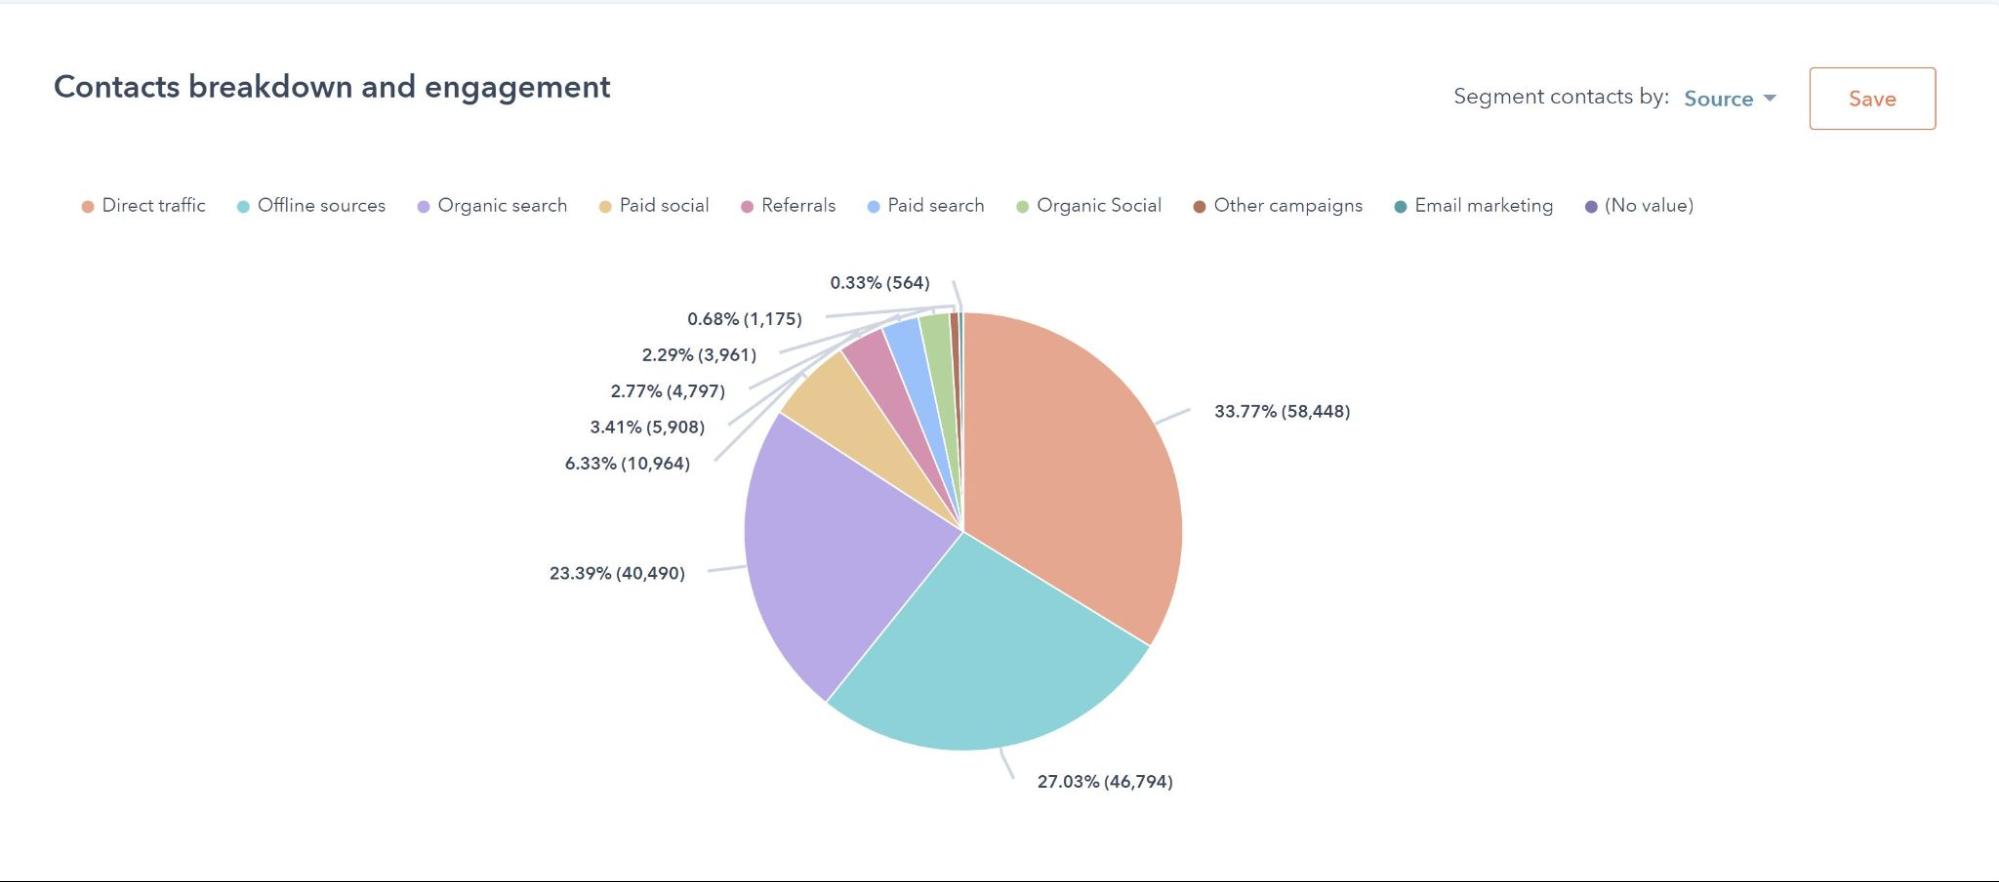
As you can see, the majority of our subscribers are coming from offline sources and direct marketing. These sources are basically a marketer’s worst nightmare because you can’t look underneath the hood, so to speak.
What we do know is that much of this is driven through a variety of events, podcasts, and other speaking engagements that lead people to type our domain name directly into their browser.
The next bucket is SEO, which has always been a major focus for us and will continue to be a major part of our strategy, although it has shifted somewhat from a pure blog keyword play to more technical SEO on our actual marketplace pages.
In Q3, we started doing what we call rifle campaigns that target specific segments of our audience. The general idea is that a piece about Amazon FBA should only be emailed to people interested in Amazon FBA.
Initially, this worked great in terms of open rate and relevancy. It worked so good, in fact, that we did away with our long-standing Content Wrap Up we sent every week to inform our audience of our latest pieces of content.
Then we ran into a problem.
Almost all of the content we were creating was just for Amazon FBA entrepreneurs.
Pretty much none of our audience outside of them heard anything from us. We knew that wouldn’t do. What began as wanting to send our audience fewer emails led to us actually sending way more to a segment of our audience, and eventually just over-sending to Amazon FBA entrepreneurs in particular.
So, towards the end of Q3, we decided to revamp the system.
In the last month, we worked on figuring out how we could redo the Content Wrap Up and decided to turn the email newsletter into a “show”.
Although the show was technically launched in Q4, the original work done on it was in Q3. That show, as you may know already if you’re subscribed, is called This Week in M&A.
This Week in M&A covers:
- The latest news in both our M&A space and the ecosystem at large
- Some of our best pieces of new content
- A lot of playful humor
The general idea is to follow our philosophy to turn every aspect of marketing into an entertaining piece of content to be consumed by everyone, regardless of whether or not they use our services. In the long run, this will help retain our audience and increase engagement.
This Week in M&A has published three issues so far, and the results have been fantastic compared to our old content-wrap-up-style emails.
So far, our open rates have been 20%+, with an average clickthrough rate of slightly over 2%. As far as content email goes, these are pretty good stats, especially since This Week in M&A is being sent list wide with only a few caveats.
We’re aiming to improve on both these stats with a focus on subject lines as Q4 progresses.
The great thing about This Week in M&A is that it let’s us show our personality in a better format than our email content wrap ups.
In the old style of the Friday newsletter, we were lucky to get a read rate of 57%. The majority of people who read those emails just skimmed them, as in they had the email open for three seconds or less. There simply was no inherent value in the email itself that would make them stay. Occasionally they’d click a piece of content, but mostly they’d just exit the email completely.
Now though?
We’re seeing read rates of 80%+, which means people are sticking around for the content.
Long term, this should teach our audience to see our emails as more than merely portals to other places, but valuable in of themselves and worthwhile to star, open, and browse through.
If you’re curious to see what modeling our newsletter after the Hustle or Morning Brew turned into, then go and subscribe to This Week in M&A today.
What Happened in Q3 of 2021?
We Grew Yet Again!
We hire new people each quarter across all of our departments. It is all part of our growth trajectory, and we need help to get to where we want to go.
If you’ve interacted with us before, then you’ll notice new faces across sales, operations, and even marketing.
In marketing, we hired a referral manager (more on that later) and three new content specialists that are helping craft new content and make our content production more streamlined than ever before.
If you’ve been looking for an awesome company to hang your hat at, then consider us. You can find all of our new job openings here.
Launching Our Referral Program
For years, we’ve had a referral program that we’ve never really talked about. In fact, we proactively chose not to speak about it because we had no real system or technology built around facilitating a referral program.
Over the years, we’ve tried a few out-of-the-box solutions, but they were always nonstarters. Our business is radically different from most business models out there, which inherently makes using out-of-the-box solutions incredibly difficult for us.
We’d spend months working with companies to develop the custom solutions we needed to make these out-of-the-box referral softwares work for us and, in the end, we’d always scrap it.
In general, referral partners have sent us very little in the way of business over the years. Because of this, the creation of a referral program has always been one of those projects on the back burner. Of course, all of this changed once we hired a referral manager to work on the project. We finally gave this area of our company the love it deserves with someone running it full time.
During Q3, our referral manager worked with our engineering team to develop a first-class referral software specifically designed for the M&A industry.
We knew we wanted something far more robust than what other brokers have.
Typically, referral agreements are handshake deals and an email intro with no real system in place. We went the opposite way and developed a program that would empower our referral partners to send deals to us with as little friction as possible.
Our software gives our referral partners the ability to create their own customized links so they can share any Empire Flippers content or landing pages with their audience using their referral code. This effectively let’s them drive traffic to places like our valuation tool or any other part of our website and cookie the traffic to them.
We know the world is heading towards a cookieless future, so we went a step further with this technology. Initial traffic will have a traditional browser-based cookie, but the moment the traffic opts in for our newsletter, registers an account, or starts the vetting process, they get hard coded into our CRM tagging the referral partner that drove the click.
After all this hard work in Q3, we are confident we now have a better referral program than anyone else in the entire industry—including the aggregators.
Most referral programs work based on a single deal. Ours works on unlimited deals.
If a referral partner sends us a seller that sells their business, and then that seller goes on to buy two businesses from us using that capital windfall, then the referral partner gets paid for all three businesses as long as all three transactions happened within two years of being tagged as a referral.
This is, of course, just a high-level view of how our referral program works, but we are already working on a second iteration of the technology that will allow our referral partners to prosper with us even easier.
As of this writing, the newly launched referral program has driven $1,022,222 in commission for us. Almost all of that commission came from Q3 and Q4, with Q4 already eclipsing the entirety of Q3.
We’re still very picky on just who we allow into this program as we’re still in beta – planning on a full launch in Q1 2022.
We want quality people with a good plan and strategy in place to send us real deal flow. If you believe you are that person or know someone or a brand who is, then you can apply for our referral program here.
Introduced a Content Quality Scorecard
It is difficult to measure the success of content.
There is so much subjectivity that goes into the whole process, and it is hard to help budding content marketers identify where they are strong or weak. When you have a Google doc filled with comments and edits, it can be easy to miss obvious trends in your writing, so making improvements is a challenge.
Because of this, we created a Content Quality Scorecard that attempts to systemize the entire process. Our content specialists and their managers can each fill out one of these content quality scorecards, giving them the ability to discuss where improvement can be made and where their strengths lie so they can emphasize their strengths as they create content.
If content marketing is a big push by your company and you want to check out the scorecard, you can find our standard operating procedure for it here and a sample scorecard you can copy for yourself.
Promoted Two Vetting Supervisors
As our organization grows, we develop more opportunities for people to rise up into managerial positions. A few months back we promoted our content specialist Sarah Nuttycombe, host of the Opportunity podcast, to content manager, and in Q3, we promoted two of our vetting specialists into vetting supervisor positions leading their own teams.
We promoted Ryan Tansey and Ross Stuttard, two long-time employees and veterans of the vetting process, to help lead the vetting team to even greater heights.
It is always good to see how far we’ve come. It was only a few years ago when the entirety of our vetting team consisted of a single person that also happened to do the entirety of our migrations and customer service as well.
Few companies ever get to grow to where they get their second rung of leaders, and even fewer get to see a third generation of leaders appear.
Launched Our TrustPilot Page
A small update worth talking about is taking more ownership of our TrustPilot page.
In the past, we’ve relied on Google and Facebook reviews, but both of these are somewhat poor vehicles for showing true social credibility. Many tech-enabled startups like us use TrustPilot, and we had already had a few smatterings of reviews there that just happened organically over time.
We started noticing more of our audience choosing TrustPilot over other platforms to talk about their experience with us, and so we’ve decided to bring it into the fold as the main area for funneling customer reviews, which includes adding it to our post-purchase follow-up emails to customers.
If you’re a customer of ours and have an experience you’d like to share, you can click here to leave a review.
Here’s a nice review from a customer of ours that is also a helpful reminder of the inspiring nature of what we do:

If you want to be like Tony, you can always start the process by selling your business here.
Launched Round Two of Empire Flippers Capital
Empire Flippers Capital (EFC) has been the talk of the industry for a few months now. The program itself is off to a great start with Round 1 operators completing acquisitions and the launch of Round 2 taking place in Q3. We’re excited to see the performance of these deals over the next few quarters. At the time of this report there are no deals open for investment, but you can fill out this form to be notified when the next investment round opens.
Overall, Round 2 looks very similar to Round 1 with a few exceptions. In Round 2, we expanded beyond Amazon FBA, and Content businesses to include DTC (Direct-to-Consumer) Ecommerce and Amazon KDP. These are monetizations that we see significant deal flow of on the EF Marketplace. We plan to expand monetization types in the future.
Another big change in Round 2 is the introduction of the concept of acquisitions advisors. We discovered that while the operators in Round 1 were successful entrepreneurs, that didn’t necessarily mean they were shrewd dealmakers when it comes to acquiring digital assets. To help our operators out, we’ve enlisted some of the most prolific digital asset buyers in our network to act as a kind of advisory board. They help our operators negotiate the deals, learn the ins and outs of deal structuring, and understand their buy boxes better so the investors can benefit the most.
During Round 2 we also implemented a more in depth operator selection process which helped us to add some of the top online entrepreneurs to our pipeline. In this Round we had over 100 applicants to raise funds with us, of which we selected 5. This allows us to cherry pick the best of the best operators for the program. If you’re interested in applying to become a future operator, fill out our operator interest form here.
We see the key to success of the program and our ability to scale will depend on recruiting enough talented operators to participate. We will be going into 2022 with a defined plan to create an ever-growing pipeline of talented operators to work with EFC and our investor network and feel confident in our ability to do so.
Leveraging Traditional Commercial M&A Processes for Amazon FBA
One of the unique aspects of how we are set up compared to other brokerages is our team-based, process-driven approach to helping people buy and sell online businesses.
Other brokers are set up like traditional real estate brokerages where each realtor eats what they kill, so to speak. We use a hybrid model where our sales team members benefit from each other’s success, and thus are incentivized to help each other.
Because of this team-based approach, we’ve been able to adopt a more traditional commercial M&A approach. The great thing about this is that the seller has buyers actively submitting offers in a series of rounds, and the seller decides which buyer had a good enough offer to go to the next round.
The buyers that don’t make it to the next round are eliminated from the contest of acquiring that business.
I would make a Squid Games joke here, but the right metaphor hasn’t come to me.
Right now, we can only do this for Amazon FBA businesses that meet certain criteria. This Select Process is highly sought after, but only a handful of businesses will meet the criteria. We do this because we want the process to be a no-brainer for our buyers; the Select Process is so selective that if a buyer sees a deal in it, they instantly know that business is quality and something that would be a wise purchase.
If you want to see if your Amazon FBA business qualifies for the Select Process, read this blog post we wrote discussing it in greater detail.
That’s a Wrap!
And there you have it: Q3 in a nutshell.
We’re already in the middle of Q4 at the time of writing this, and there are even more exciting updates to share with you for the next report that we can’t talk about just yet, so stay tuned.
Hopefully, this report has inspired you.
Let us know how your quarter has gone.
If you’d like to sell your business for a life-changing exit, click here.
If you’d like to buy a profitable business, click here.

