2021 Q2 – April, May, June
 Updated on January 27, 2025

Q2 was a historic quarter for our company.
In more ways than one.
While we didn’t beat Q1 in terms of raw revenue, Q2 was the 2nd largest quarter in our company’s history. The total revenue earned in Q2 came incredibly close to that of Q1, with Q1 coming in at $47,339,631.23 and Q2 right behind it at $47,154,576.70.
These are huge numbers. Numbers that tell a huge story.
The story of the M&A industry growing by leaps and bounds. Several of our clients recently raised enough capital to become unicorns, and we’re seeing transitions happening to where aggregators are no longer restricting their acquisitions to only Amazon FBA.
The season of the seller carries on as the seller’s market continues to sizzle. The marketplace is frothy, and there’ve never been more deals for buyers to acquire, nor a better time for entrepreneurs to make a meaningful exit.
Let’s dive into what happened during Q2 from our revenue, traffic, and other events that transpired.
Executive Summary: Q2 2021 Report
Q2 2021 Business Data
Business Data
Total team members: 88
- Founders: 2
- Sales team members: 20
- Marketing team members: 8
- Operations team members: 32
- Engineering team members: 10
- Human resources team members: 2
- Finance team members: 2
- Contractors: 2
Email subscribers: 204,014
Podcast downloads: 51,240
Site visits: 287,493
Revenue:
Brokered site sales: $47,154,562.14
Additional/other revenue: $14.56
Average deal size: $542,006.46
Total revenue: $47,154,576.70
Earnings:
Brokered site earnings: $3,956,617.02
Earn-out payments: $144,772.37
Additional revenue: $14.56
Total gross earnings: $4,101,403.95
30 Seven-Figure Businesses for Sale Right Now
Q2 saw our marketplace boom with businesses in the seven-figure range.
Of course, you don’t need this list to tell you. When you sign up for a free Empire Flippers marketplace account you’ll have the ability to filter our marketplace by price range to fit whatever your budget is, plus a bunch of other industry-first features that we’ve designed into the marketplace to make your deal finding job easier.
Here’s a list of all the current seven-figure listings we have for sale in the marketplace.
- Listing #52892: An affiliate and display advertising business created in January 2019 in the cryptocurrency niche. This business features multiple websites and has diversified revenue across 23 different affiliate programs. The business is valued at $8,562,945.
- Listing #50045: An Amazon FBA and FBM business created in December 2004. This business is recognized as one of Amazon UK’s top 100 companies and is valued at $7,204,383.
- Listing #53349: A SaaS business launched over five years ago in the social media niche. This business boasts a 75% profit margin, with revenue stabilizing around $180k per month. This business is valued at $7,099,134.
- Listing #49202: An e-commerce and Amazon FBA business created in May of 2014 in the beauty niche. The business is a part of Amazon Brand Registry 2.0 and includes two Shopify storefronts, an Amazon Seller Central account with three SKUs, an email list with over 10,000 contacts, and a trademark. This business is valued at $4,258,830.
- Listing #53335: An Amazon FBA, e-Commerce, and wholesale business created in August 2010 in the home niche. The Amazon Seller Central account included with this business features 98 SKUs for a hygiene product as well as other home products. Some products have Best Seller and Amazon’s Choice tags, along with thousands of positive reviews. This business is valued at $3,706,272.
- Listing #51430: An Amazon FBA and e-commerce business created in August 2009 in the home niche that features thousands of positive reviews. This e-commerce business utilizes multiple platforms to sell outside of Amazon, including Walmart, Shopify, and eBay. This business is valued at $3,364,877.
- Listing #51414: An e-commerce and Amazon FBM business created in April 2012 in the pet care niche. This business boasts 84 high-ticket item SKUs and plenty of positive reviews. This business is valued at $3,171,711.
- Listing #51547: An Amazon Associates, KDP, and info product business created in November 2014 in the outdoors niche. The site has over 1,000 published articles with a strong DR 58 and a highly engaged community with over 35,000 email subscribers. This business is valued at $2,228,031.
- Listing #53295: An e-commerce business created in January 2019 in the electric mobility niche. The store is built on Wix, and the business is in a growing industry that promises increased revenue and traffic. The store features 2 primary SKUs and 6 accessory products. This business is valued at $2,179,566.
- Listing #51831: An affiliate and display advertising business created in February 2017 in the dating niche. The website is a DR 57 and boasts an email list of 56,000 subscribers. The business features three revenue sources, but affiliate and display make up the majority, with affiliate being 61.88% and ads making up 32.84%. This business is valued at $2,158,160.
- Listing #51935: A SaaS business created in October 2015 in the sports niche that provides analytics to sports fan subscribers. This business features a solid social media following with over 24,000 subscribers to its YouTube channel. The business is valued at $2,121,111.
- Listing #54182: A display advertising, Amazon Associates, and affiliate business created in February 2014 in the hobbies niche. The site features over 1,100 articles. Advertising makes up the lion share of the revenue. The business is valued at $2,112,164.
- Listing #52900: An Amazon FBA and eCommerce business created in March 2015 in the art niche. This business features 63 SKUs and an email list of over 69,000 subscribers. This business is valued at $2,082,899.
- Listing #50439: A US-supplied dropshipping business created in January 2012 in the food & beverages niche. While paid traffic is the main channel, there is also a small amount of SEO traffic driven through the blog. This business is valued at $2,027,234.
- Listing #51727: A two-site package of dropshipping sites created in September 2018 in the outdoors and equipment niches. This business features year-over-year growth, with slight seasonality tied to the summer months. This business is valued at $1,868,580.
- Listing #54093: An Amazon FBA and eCommerce business created in April 2019 in the beauty niche with 21 SKUs on site and an additional 25 SKUs with Walmart and Shopify. The revenue is diversified across multiple platforms, with Amazon FBA making up 47%, Shopify 28%, and Walmart 21%. This business is valued at $1,589,393.
- Listing #48901: A subscription and dropshipping business created in January 2018 in the art niche. The lifetime value of this business is high, with many customers being repeat buyers and the primary revenue driver being a subscription box product. This business is valued at $1,510,440.
- Listing #54797: An Amazon FBA business created in August 2015 in the home, kitchen, and health & fitness niches. Included with the Amazon Seller Central account are 83 SKUs and 3 trademarks. The products have gathered thousands of reviews collectively across both marketplaces, and the best-selling SKU has a 4.6 average star rating with over 3,200 reviews. This business is valued at $1,439,532.
- Listing #53769: An Amazon FBA business created in December 2016 in the sports niche. The included Amazon Seller Central account features 28 SKUs for massage-related items and sporting equipment. Products are sold in many different Amazon marketplaces, including North America, the EU, Australia, Singapore, Saudi Arabia, and the UAE. This business is valued at $1,318,887.
- Listing #54661: An Amazon FBA and eCommerce business created in October 2014 in the supplements niche. The products are sourced from the US and have over 3,000 reviews collectively, with a couple of SKUs awarded with the Amazon’s Choice badge. The business is valued at $1,269,660.
- Listing #55040: An Amazon FBA and eCommerce business created in January 2015 in the personal care niche. The business is valued at $1,249,663.
- Listing #50297: A dropshipping, Amazon Associates, and display advertising business created in October 2016 in the outdoors niche. While the business gets the majority of its traffic from organic search, some traffic also comes from direct searches and their social media following, allowing for an opportunity to expand. This business is valued at $1,234,067.
- Listing #54825: A display advertising business created in March 2008 in the finance niche that offers a visualization tool for traders to help make investment decisions. The site has grown significantly month-on-month and year-on-year in traffic and revenue. This business is valued at $1,225,903.
- Listing #54096: An Amazon FBA and eCommerce business created in April 2014 that features 87 SKUs for office decorative products. All of the products sold by this brand have 4+ star reviews, with some products having well over a thousand reviews. This business is valued at $1,225,277.
- Listing #47601: An Amazon FBA and eCommerce business created in September 2018 in the equipment niche. The included seller central account features a range of outdoor equipment with 568 SKUs. Revenue is diversified across three platforms, with Amazon FBA accounting for 60%, eBay 30%, and Shopify 10%. This business is valued at $1,195,321.
- Listing #50885: A digital products business created in September 2016 in the business niche. The business generates revenue from a popular digital product website and includes up-sells for additional products and customized work. The products have a high satisfaction rate, with an average review score of 4.8 across 2,000+ reviews. The business is valued at $1,178,237.
- Listing #52633: An Amazon FBA business created in September 2015 in the home and office niches. Included with the Amazon Seller Central account are 76 SKUS (47 in the US marketplace and 29 in the EU marketplace). The business is trademarked in both the US and EU and is part of Amazon Brand Registry 2.0. The products have strong reviews, with many of them averaging a score of 4.5 and the best-selling SKU garnering an average of score of 4.6 across 1,800+ reviews. This business is valued at $1,149,375.
- Listing #50681: An affiliate and Amazon Associates business created in May 2017 in the home niche. The site has diversified revenue, with Amazon Associates making up 30% and the remaining 70% spread across multiple different programs. This business is valued at $1,119,456.
- Listing #53864: An Amazon FBA and eCommerce business created in July 2020 in the lifestyle niche. They have gathered thousands of positive reviews, averaging a 4.9 out of 5 for one FBA product and one FBM product. This business is valued at $1,106,392.
- Listing #54620: An Amazon FBA business created in June 2017 in the kitchenware niche. The trademarked brand includes Brand Registry 2.0 and the top-selling SKU is currently Amazon’s Choice with over 1K reviews. This business is valued at $1,082,460.

Revenue Breakdown
Brokered Site Revenue
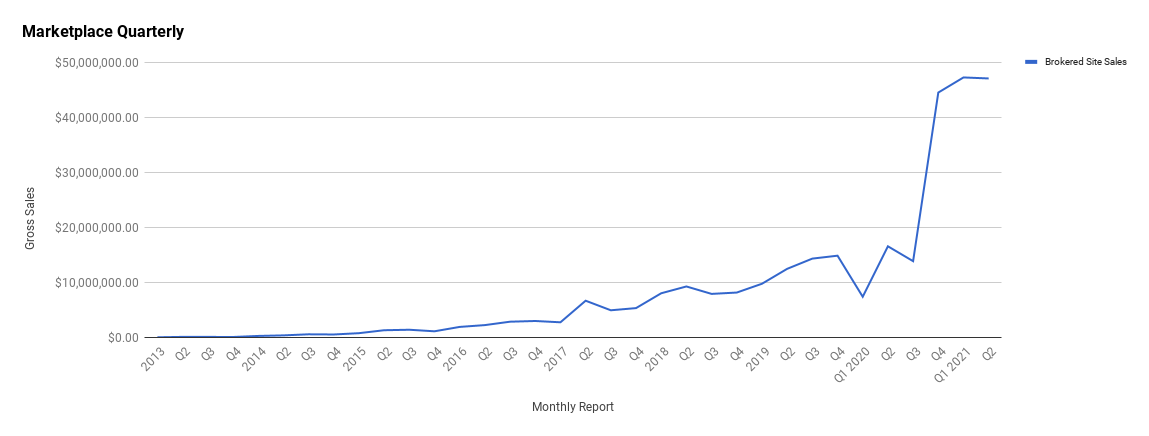
In Q2, we had our second highest quarter ever, with $47,154,576.70 in revenue.
Our last two quarters were characterized by a significant increase in revenue over previous quarters. In the graphs below, you can see the market starting to heat up in a dramatic way starting in Q4 2020. While the graph makes Q3 2020 look like it was a bad quarter for us, it actually wasn’t. Q3 2020 was another amazing quarter for the company. But the success of Q3 2020 can’t hold a candle to the quarters that came after.
Below is a breakdown of our quarter-by-quarter growth:
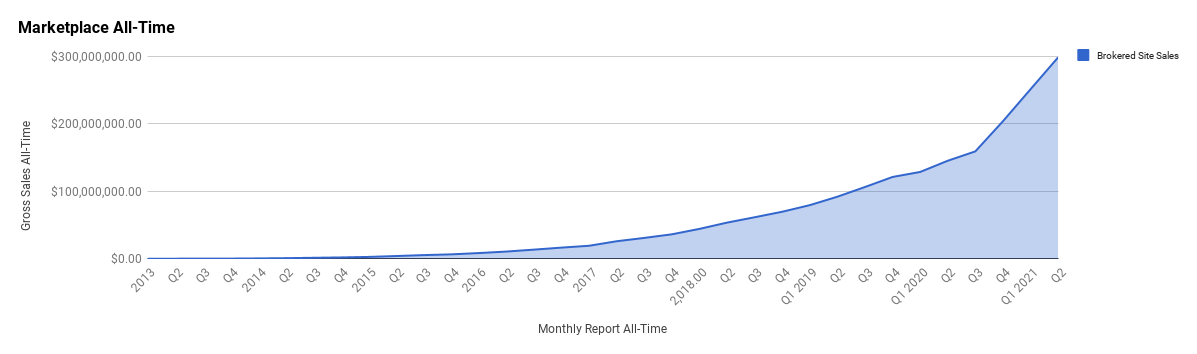
The growth we’re experiencing is even clearer when you look at everything in aggregate.
Here’s a look at our overall marketplace sales:
The success we’re seeing is due in large part to the same trend that is causing valuations to rise so dramatically.
We discussed these market influences in depth in our Season of the Seller blog post, but the basics of what is happening are as follows:
- New investors coming from other sectors (such as real estate)
- Aggregators aggressively raising capital and competing with each other
- The pandemic driving huge swathes of the global population into the e-commerce world
- A giant uptick in investor interest in online business thanks to aggregator success
- Mainstreet investors wanting a piece of the action in the lower pricing tiers
You might be wondering if this is all a bubble of some sort. The graphs certainly seem to show something odd happening here.
From our perspective, though, we don’t think it is a bubble. What we’re seeing is that digital assets are finally becoming mainstream. In the past, we were always a bit off the beaten path when it comes to investing. Acquiring businesses has always been a solid investment strategy for the right investor, but online businesses were, and in many ways still are, so new.
We’re seeing online businesses come to parity with more traditional offline business assets in terms of valuations, and we don’t see anything on the horizon that could change the current trend’s trajectory.
By looking at our average deal size, you can see evidence of the increase in valuations, the rush of new buyers, and the many seven-figure businesses we now have for sale.
Here is how our average deal size has changed over time in the marketplace:

The average deal size for the last 3 quarters has consistently been over $500,000.
- Q2 2021 – $542,006.46
- Q1 2021 – $544,133.33
- Q4 2020 – $557,338.03
To put that growth into perspective, before Q4 2020, our average deal size was $171,340.55.
The confluence of events responsible for these numbers represent a good sign for our industry. Not so long ago an online business was usually a side hustle someone might have on top of their day job. Nowadays, online businesses are truly becoming full enterprises, leaders in their industry. They’re also soaking up the lion share of their respective markets.
So, what does all this growth in our marketplace look like on the actual traffic side of the equation?
Let’s dive in.
Traffic and Audience
Blog Traffic and Analytics
Our blog remains one of our best traffic channels as we rank for countless SEO-optimized keywords. It’s not just our blog though; we’ve worked hard to optimize our actual public marketplace, and that has paid us huge dividends in organic traffic.
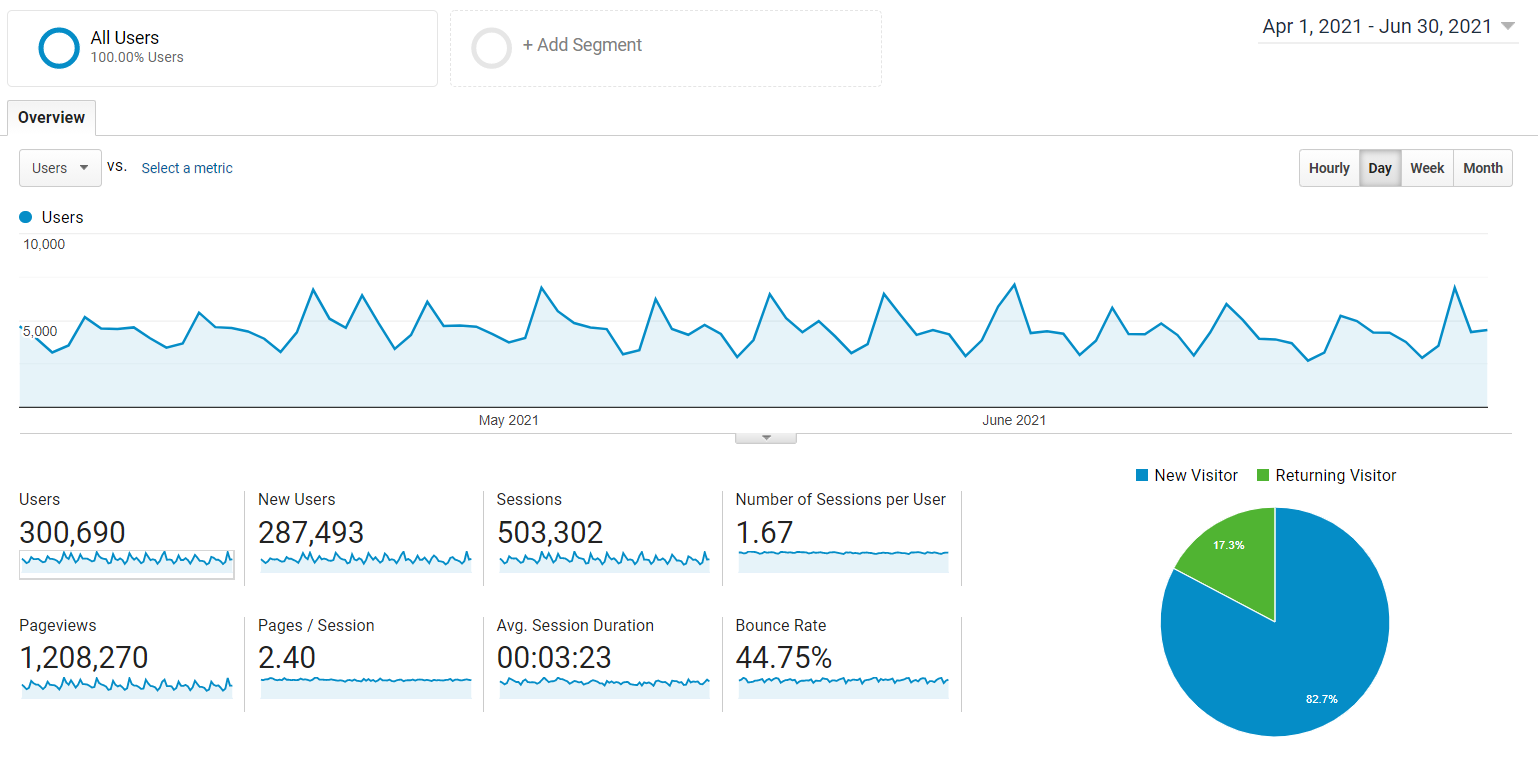
Here’s our traffic for Q2:
 Here’s how that traffic compares to Q1 2021:

We had 287,493 new users visit our website during Q2 2021, and while our average session duration decreased in Q2 compared to Q1, an average time of 3:23 is solid. The time on site is especially good when you consider that many of these visitors are registering for free marketplace accounts, which involves heading off our main site to our customized marketplace.
While our User and New User growth may appear marginal, these are actually significant numbers. We are on track to increase our overall annual SEO traffic from 2020 and exceed 20% growth in 2021.
These increases are mainly due to increased interest in our industry and our recent heavy focus on SEO topics.
Here are our top referring channels:
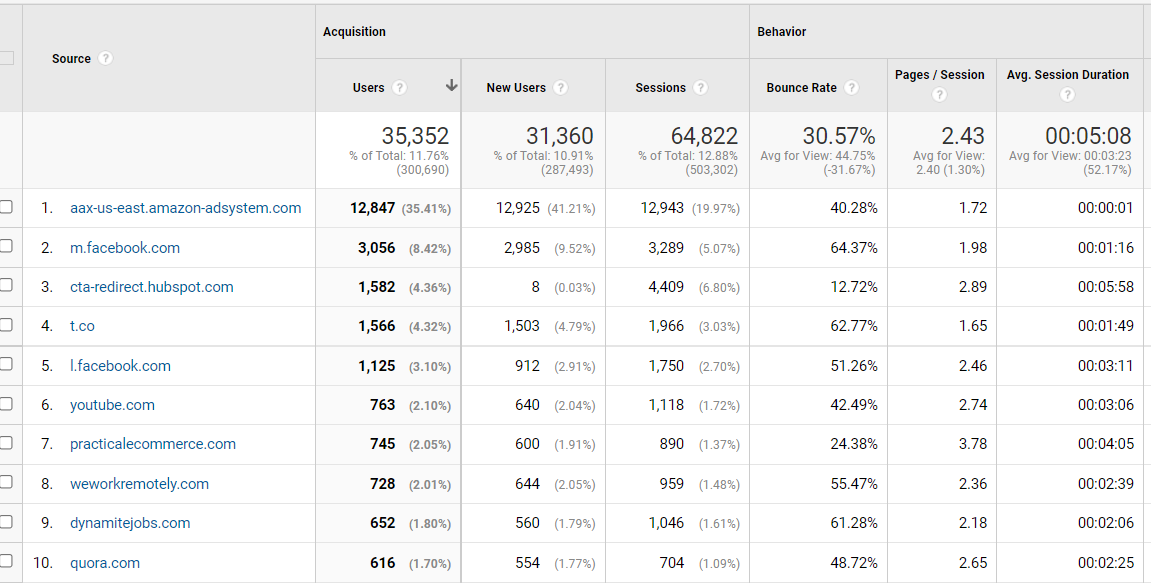
You can see a new top referrer on the list. We tested out Amazon DSP ads in Q2, which drove a solid amount of traffic to our website. However, you can see that the average session duration is extremely low. Our ad campaign here seems to have failed on several fronts; almost all of them related to tracking. At the moment, we can’t see clearly whether or not the traffic we got translated to anything more than website visits, but the low average session times don’t give us much confidence that this will be a good channel for us even if we solved the conversion tracking issue.
Still, we’re troubleshooting what happened because we would like to experiment with Amazon ads again.
As you can see, Facebook remains one of our main social traffic sources, followed by twitter. What’s interesting to see is that Quora is still in the top 10. As you may remember from a few Q reports ago, we put a lot of time and effort into our Quora content marketing strategy.
The strategy wasn’t a fruitful one initially, so we shifted focus. Over the long term, however, the strategy seems to be working in our favor. At this point, our activities on Quora have become moderately profitable. While it’s probably not worth refocusing on Quora now, given the other opportunities available, it’s nice to see our hard work rewarded with not only traffic, but also actual entrepreneurs submitting businesses for sale.
Here are our three most viewed pages:
Here are our three most viewed listings:
- Listing #50045: An Amazon FBA business created in December 2004 in the food & beverage niche. This business is currently valued at $7,204,383.
- Listing #52892: An affiliate and display advertising business created in January 2019 in the cryptocurrency niche. This business is currently valued at $8,562,945.
- Listing #51346: (SOLD!) An Amazon Associate site created in January 2019 in the jewelry niche. The sale price of this business was $17,740.
Here are our three most viewed pieces of content:
- How to Start an Amazon FBA Business
- 3 Secrets to Exiting Your Ecommerce Business On Demand Webinar
- SaaS Business Model Explained
Here are our three most viewed recent content pieces:
- 3 Secrets to Exiting Your Ecommerce Business On Demand Webinar
- 11 Best Affiliate Programs for Beginners to Make Money
- Set Up and Start Selling: How to Create Your First Amazon Seller Account
Educational YouTube Channel
We are continuing to produce educational YouTube videos, and Q2 has been our most consistent quarter so far in terms of output.
We saw some small but promising growth in Q2, but it has been slow-going.
Here’s our analytics snapshot for Q2:

Roughly midway through Q2, we started consistently publishing 2 videos per week, and we are attempting to do something similar in Q3 2021. While the growth has not been as fast as we would have liked, it is producing actual results for us in terms of people registering for free marketplace accounts, filling out the valuation tool, and deciding to sell their businesses with us.
Video is definitely the future for content marketing, so while we’re not where we want to be yet, we’re also not giving up. We believe YouTube could become a major traffic source for us over time. It allows us to interact with our audience in a way that our written content simply can’t.
Below, you can see the Q3 growth we’ve experienced up to the time of writing.
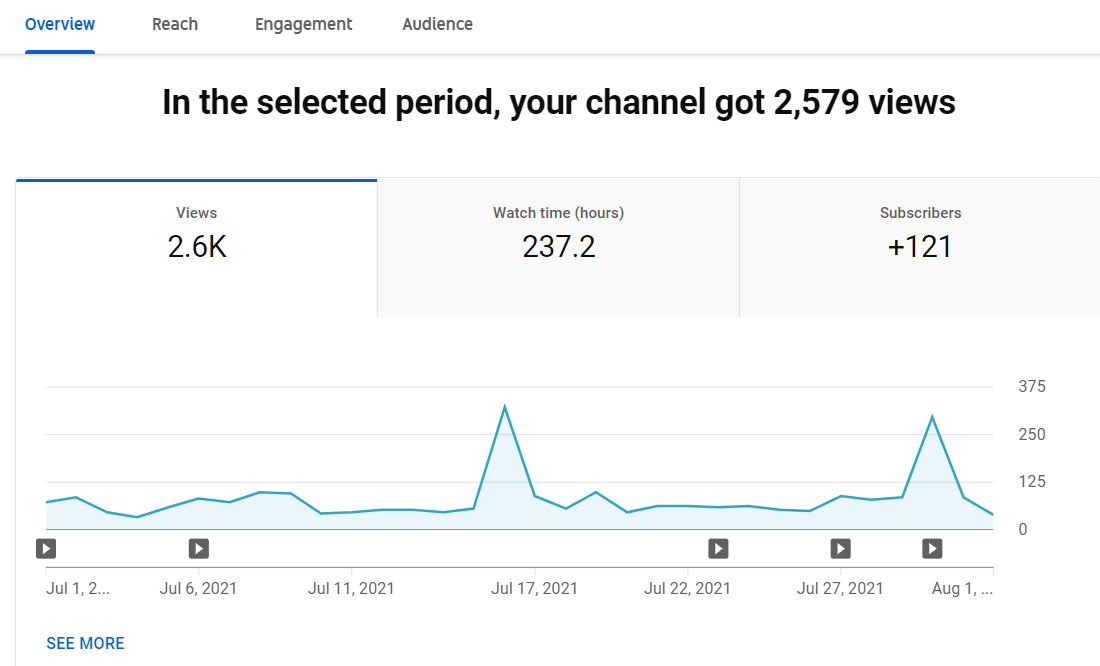
The graph above shows view data from July 1st to August 2nd.
As you can see, our channel views are likely to end up eclipsing Q2 in a meaningful way. We’ve also surpassed 1,000 subscribers, so we got access to the YouTube community tab, which may help us create a more engaged following.
Our YouTube channel is a great reminder that even if you’re getting relatively low traffic to your business from a given source, it can still be a major revenue driver for you if you’re selling high ticket products.
If you’ve been thinking about getting into YouTube for your business, we highly recommend it. There’s a steeper learning curve and more moving parts than with other sources, but the traffic can be extremely valuable, and it will separate you from most of your competition.
Here are our top-viewed videos for Q2:
- How to Sell Your FBA Business with These Easy Steps
- How Do Valuations for Small Companies and Online Businesses Work?
- What is a Business Broker? Do You Actually Need One?
Podcasts and Shows
Podcasts remain one of our favorite methods of producing content; we can give business buyers, sellers, and industry thought leaders exposure to our audience.
In general, podcasting is one of the best formats for establishing trust in your brand. Its long-form format and casual conversational content help you develop a relationship with your audience. It allows people to consume your content as they go about their lives, whether they’re working in an office or working out at the gym.
This is another medium we highly recommend entrepreneurs use. Similar to starting a YouTube channel, you’ll differentiate yourself from your competitors easily as few people in your industry will have a podcast at all, let alone an engaging one.
In Q2 2021, we had 51,240 downloads across 3 shows.
Let’s take a closer look at each show.
The Empire Flippers Show
The Empire Flippers Show is our flagship show. In it, our co-founders Justin Cooke and Joe Magnotti speak with a variety of industry experts and dish out their own wisdom from their years of entrepreneurial experience.
While the show hasn’t been as active recently as it once was, it still gets a sizable amount of downloads from the years of episodes already published.
In Q2 2021, there were 15,948 downloads with large spikes at the start of the quarter that leveled out as time went on.
Here are our downloads for Q1:

Here are the top three most listened to episodes for the quarter:
- EFP 213: After the Exit
- EFP 212: Introducing EF Capital
- EFP 129: Dan Pena on Creating $50 Billion in Value
The Web Equity Show
The Web Equity Show was a partnership between Justin Cooke and company friend Ace Chapman. Unlike other podcasts, Web Equity was built around the idea of having multiple seasons, each of which would take a deep dive into a single section of the M&A industry
The first 3 seasons in particular make up some of the best, most structured education you can have if you’re brand new to the concept of buying and selling online businesses.
Here are our downloads for Q2:

Here are the top three most listened to episodes for the quarter:
Real Money Real Business (RMRB)
The RMRB Show is where we interview active sellers in our marketplace. We discuss how they went about building the business and allow them to share their tips, strategies, and insights with you.
One of the most unique aspects of this show is the fact that we actually know these entrepreneurs have created a meaningful business. After all, we built their profit & loss statement.
The RMRB Show goes through spurts of publishing, as it is based purely on how many new live listings we’ve had in the marketplace. We aim to interview every seller who has built a business over a certain threshold.
This show doesn’t just serve as a great (often daily) dose of inspiration for entrepreneurs, but also as a way to promote the businesses we have for sale in the marketplace.
The old adage that people who know, like, and trust you are likelier to buy from you is never truer than in the M&A industry. These interviews give our sellers a powerful tool to let buyers get to know who the entrepreneurs are without the buyers themselves needing to do anything to go out of their way to do so.
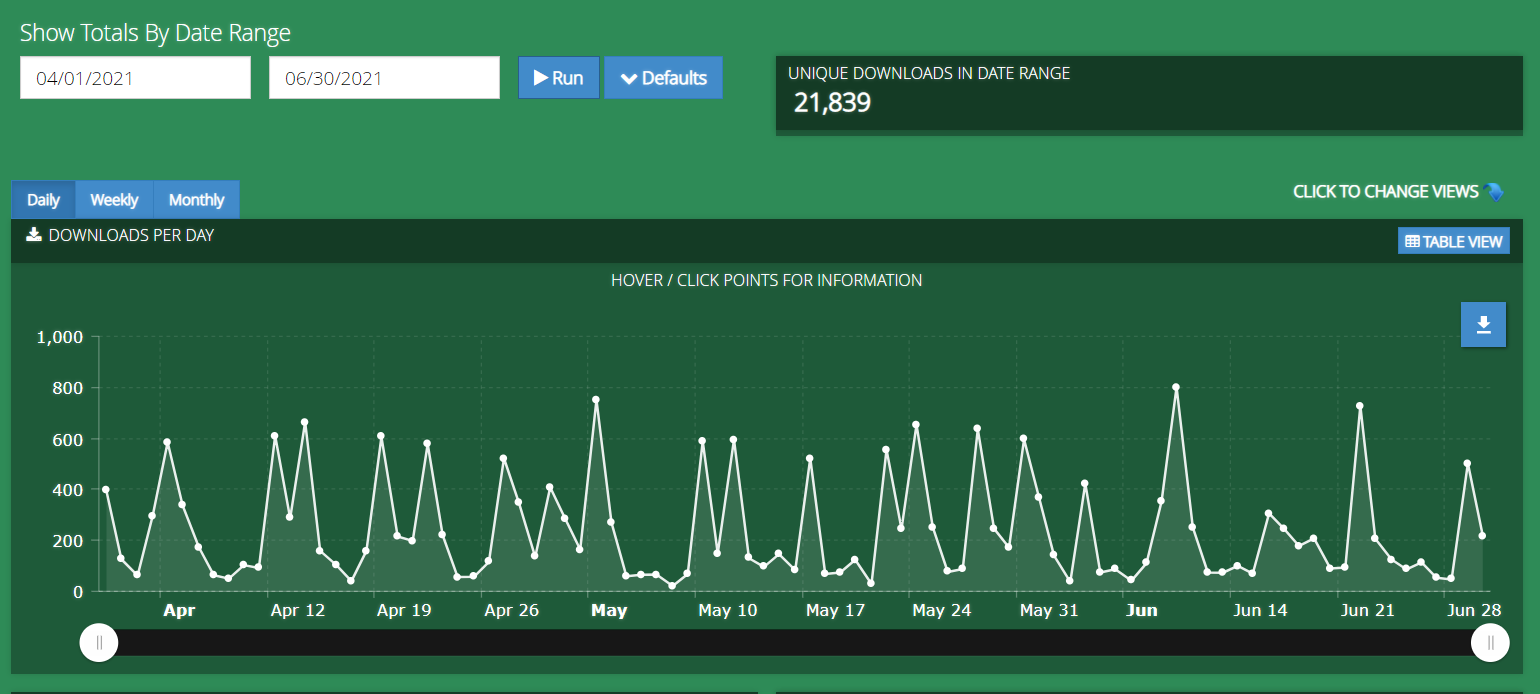
In Q2, we had 21,839 downloads. This makes RMRB our most widely downloaded show at present. A major reason for this success is publishing frequency.
There are weeks when we list 18 businesses in our marketplace, so in a single week, we may have as many as 18 episodes scheduled. While this number fluctuates, it’s rare week indeed that sees us publishing release fewer than 7 shows.
This kind of aggressive frequency also leads to tons of downloads for us.
Here are our downloads for Q2:
Here are our top three most listened-to episodes for the quarter:
- RMRB 305: Crushing Social Media as a Traffic Channel to Build a 6-Figure Advertising Business
- RMRB 351: Building an Affiliate Business Featured by the New York Times
- RMRB 313: How a Seller Built a 6-Figure Affiliate Business to Solve Their Own Problem
The Opportunity
The Opportunity Show is a podcast mainly dedicated to interviewing people who buy businesses.
Many people talk about selling a business, but very few ever create content about what happens after a buyer acquires an asset. While this was the starting point for The Opportunity, it has now expanded to include industry thought leaders, high-level sellers, and other people who are doing big things in the M&A space.
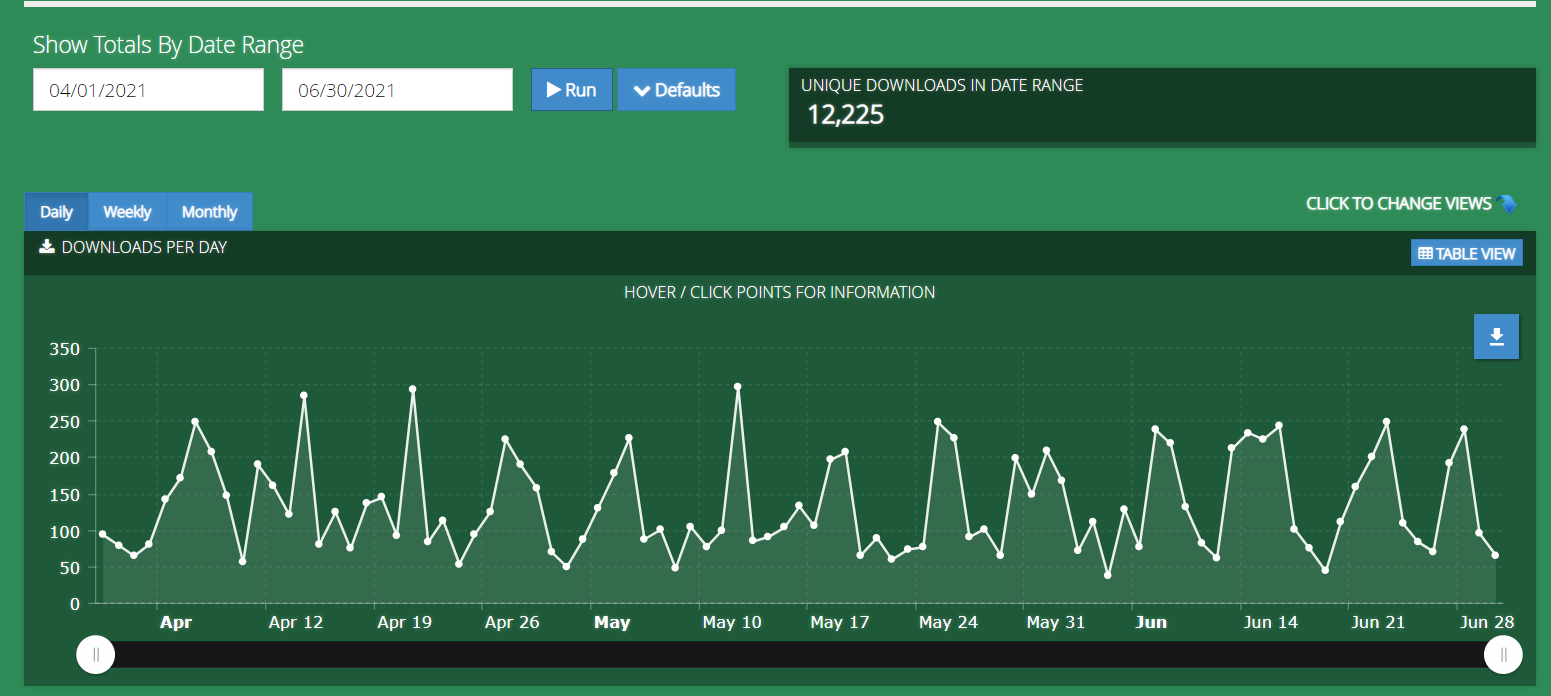
In Q2, we had 12,225 downloads, and in Q3 we hope to beat that number.
One thing we are excited about is getting even bigger entrepreneurs and investors on the show. Our goal is to show our audience what they can achieve with the right mentality, perspective, and hard work when it comes to the brands they’re building.
Here are our downloads for Q2 2021:
Here are the top three most listened to episodes for the quarter:
- The Opportunity Ep.41: Using Expert Writers to Build Authority in Your Niche
- The Opportunity Ep.40: Finding Great Deals as a Buyer in a Seller’s Market
- The Opportunity Ep.39: Due Diligence War Stories from a Leading FBA Acquirer
Email and Contacts
Email remains our most powerful marketing channel.
Almost everything we do is meant to feed our email marketing automation. Once someone subscribes by registering for a free marketplace account, filling out the valuation tool, or simply submitting their business for sale, we try to help them get to the next step.
When you’re selling a high-ticket item like we are, you will need to earn your audience’s trust. While content creation helps with this in a major way, the ability to stay connected to our audience via email is truly the glue that allows the trust between our brand and our audience to deepen.
To say that we take email seriously is an understatement. There’s almost never a quarter that goes by in which we haven’t made some sort of email marketing goal to achieve.
You can see our growth from January 1st, 2020 to June 30th, 2021 in the chart below.
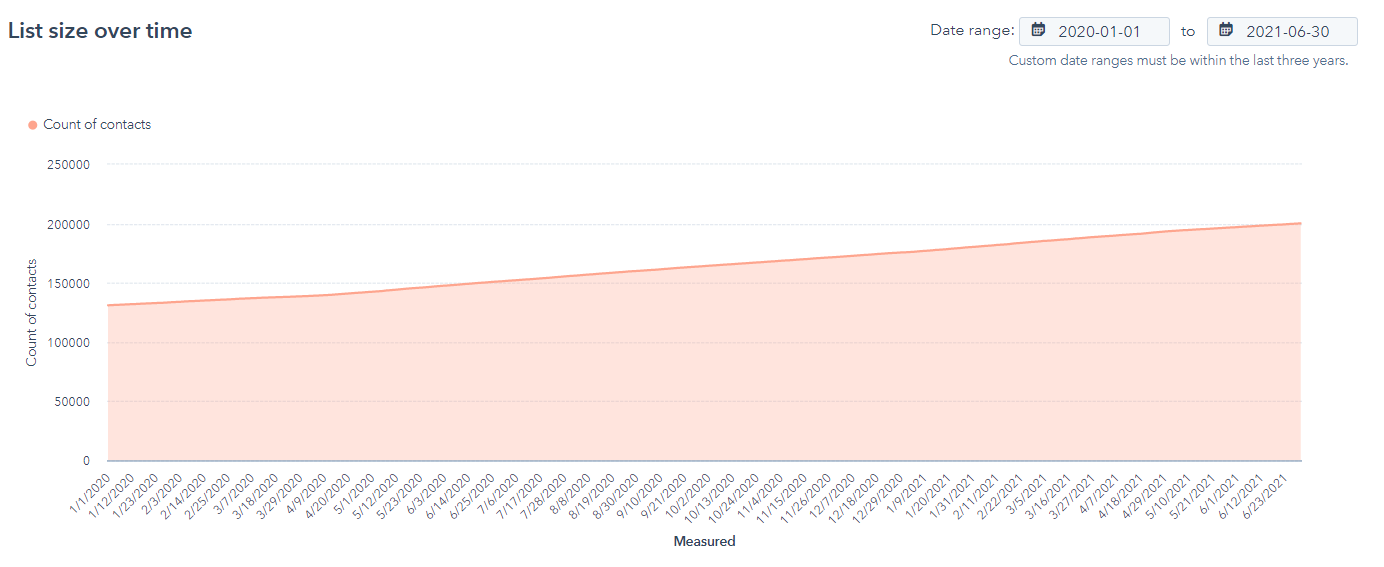
While the subscriber growth shown in the chart above may look trivial, it’s anything but; it actually represents our list growing by the thousands.
As of the end of Q2 2021, our total contact size is 204,014 and that number has continued to grow since then.
Our subscriber base grown steadily, like a relentless clockwork machine, thanks to our long-term focus on evergreen content. Each piece of content produces just a tiny bit of traction, but when you add them altogether, you see the kind of tsunami that content can produce for you over time.
Here’s a closer look at those contacts:
Contacts Breakdown:
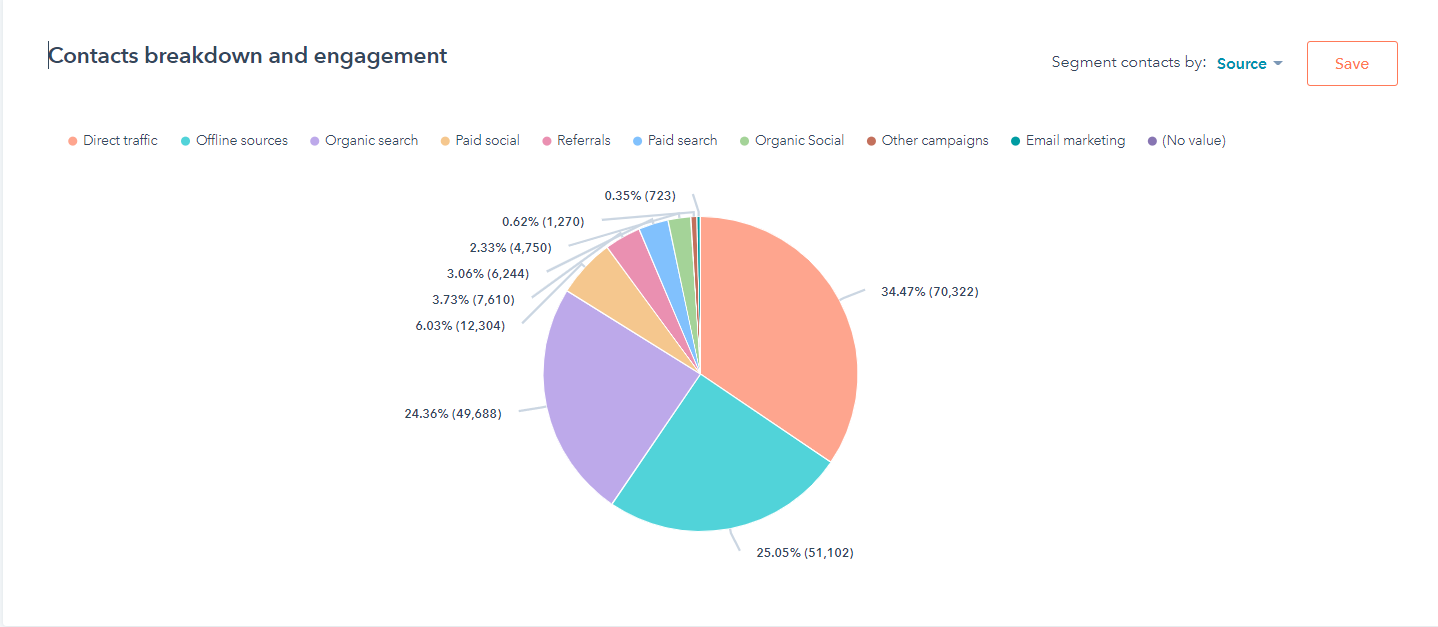
As you can see, the majority of our contacts come from direct traffic and offline sources. These are people typing our domain directly into their browser for the most part. Much of this traffic is increased brand awareness that is likely attributed to the slew of private communities we take part in on social media, but some are now drifting in from online and even offline events that have started returning to the business scene.
Organic search remains our 3rd biggest breakdown at almost 25% of all contacts generated from organic sources. Our heavy focus on SEO makes our customer acquisition cost (CAC) extremely low overall, which allows us to experiment across a host of other channels.
For example, this low CAC allowed us to experiment with several paid media traffic channels. Because of those experiments, we found one area so far that may work quite well for us once we’ve successfully onboarded an agency who specializes in that channel.
While we don’t expect the general mix of this pie chart to change much in 2021, we are hoping to shake things up a bit with the different marketing systems we’ve been working on behind the scenes for 2022.
While we know that those other channels may grow exponentially, for now, we remain heavily focused on organic sources. In addition to Google search organic, we’re also betting heavily on the long-term potential of YouTube organic.
Customer Experience
As always, customer experience is at the forefront of our thoughts. Selling your business is not a stress-free proposition, even in the best of circumstances. There’s a lot on the line, and we want to be there for our customers every step of the way to help them.
While we can’t report on this part of our business the same way we used to due to changes in how Zendesk displays data, we can still talk about some pretty big milestones that happened for us in Q2.
In Q2, our vetting team helped create the valuations of 167 businesses that listed in our marketplace. That is a value of over $104 million.
That’s not all, though.
Our migrations team continues to lead the industry. The vast majority of brokers provide zero help when it comes to actually transferring a business after the deal is done, and it makes sense considering most don’t want to get involved due to liability concerns. However, we believe in making sure everything is done right and that both the buyer and seller feel safe during the transfer.
We’ve seen just about every challenge you can imagine across most business models, and we pride ourselves on our ability to offer the wisdom of our experience to our customers.
In Q2, we were able to fully complete 81 business transfers thanks to our migrations team. They’ve continued to provide a high level of service for our sellers who themselves have entered into earnout structures during the exit of their business.
A somewhat little known fact about our migrations team is that they don’t just help you migrate the businesses you’ve sold; they also help you manage the actual earnout structure you’ve agreed to on your behalf. That way, you can focus on your next venture while we take care of your payment from your last.
Our operations team remains one of the pillars of our organization and allows us to have a more curated deal flow than any other M&A broker in the industry.
We believe these numbers will likely continue to increase as we add more people and refine our process.
What Happened in Q2 of 2021?
A lot transpired in Q2 of 2021, as the world started recovering from the worst pandemic in living memory. While things are not back to normal around the world, the online business world itself continues to evolve, adapt, and grow in fascinating ways.
Let’s examine what happened.
Aggregators No Longer Restricted to Amazon FBA
Amazon FBA aggregators made the news repeatedly throughout 2020, and they’ve continued to do so in 2021. However, there is a marked change in their activity, even from just a few months ago.
Several of them have become billion-dollar companies with the capital they’ve raised, and they have set their sights beyond just owning incredibly profitable Amazon FBA businesses.
They’ve decided to start owning the entire value chain.
Many aggregators are buying up SaaS, service, and content businesses.
The last bit is especially exciting for the many content site sellers in our marketplace. The reason why aggregators are looking to acquire high six-figure and low seven-figure affiliate businesses is because these sites act as powerful external marketing channels for their Amazon FBA listings. Plus, Amazon is now experimenting with paying people who drive Amazon traffic to their product listings.
Content sites also have incredible potential for aggregators as an audience building play when coupled with profitable research & development data that they can use to source the next winning product. We’ve been talking about this strategy for a while and have called it the “Bolt-On Wealth” strategy.
You can use the Bolt On Wealth strategy even if you’re not an aggregator. If you’re wondering how it works, check out a recent YouTube video we made on the subject below:
Another Billion Dollars in Liquidity
In Q2, 2021 we added over a billion dollars in liquidity to our buyer network.
That’s enormous.
What’s more, we’re set to do so again In Q3, making this quarter and the last some of our highest growth ever on the buy-side. This liquidity represents what our buyer network has as investable capital for acquiring businesses in our marketplace.
The most fascinating part part of this metric is the fact that it doesn’t represent all of the capital available.
Buyers show us how much liquidity they have through our proof-of-funds process. They go through this process because we only allow buyers to unlock businesses in our marketplace if they prove that they have enough capital to actually buy that business. It’s a powerful quality filter that makes sure our sellers are only dealing with people who have a high level of intent to acquire.
But buyers don’t usually show us all of their net worth; they show us just enough to unlock a target business.
This means that there is significantly more capital in our marketplace to acquire your business when you decide to sell it.
At the time of writing, our verified liquidity is sitting at $4,240,896,525.
If you want to see the most up-to-date number on that, check out our scoreboard.
An Inc 5,000 Winner Yet Again!
We won the Inc 5,000 yet again for one of the fastest-growing companies in America. This makes it the fifth time we’ve won this honor.
This is always a great honor for us, and it shows just how fast our business, and indeed the industry, is growing.
Every time we win this, we feel that we’re one step closer to introducing digital assets into the mainstream investing zeitgeist.
Accelerating Growth with Agencies
At the tail end of Q2 and continuing on into Q3, we began onboarding several agencies. The idea behind this move is to start using more agencies to perform the “accessory” parts of our marketing in order to allow us to focus on our core content and data collection efforts.
So far, we’re quite satisfied with the direction we’ve taken with regard to paid media. The agency we hired specializes in hardcore attribution tracking and analytics, which is a must for a company like us.
During the onboarding call, they outlined our marketing funnel…in a 41 page Google doc, and introduced the document with “Your marketing funnel is very complicated.”
Why yes, yes it is.
We’re excited to see what we’re going to be able to achieve as we ramp this up. Our industry is a uniquely challenging one with regard to seeking success across a variety of marketing channels, so bringing on an agency with extensive fractional CMO media buying experience could lead us to the growth we feel we can achieve in other marketing mediums.
Hiring, Promotions, and More Hiring
Speaking of hiring, we’ve hired again across the company. Each department grew in Q2 and has continued to grow in Q3, with many new faces being added to the team — you can see them all on our about page here.
We’ve also added a new position to marketing — our Referral Manager — and we’re excited to see him get started Q3 and Q4. In addition to that new position, our sales team has an opening for a brand new position – They’re looking for a capable SDR.
Engineering is also on the hunt for a Ruby-on-Rails engineer.
Outside of these new roles, we also saw marketing’s Sarah Nuttycombe promoted to content supervisor to lead our content team going forward.
Truly exciting times all around.
Outlining Our Referral Program
As mentioned above, we’ve recently filled the position for a referral manager. Our very own Jim Barton, a business advisor specializing in exit planning, has transferred over to work with the marketing department to make the program a success.
The program is still in its infancy, but we’re already in the midst of creating our own custom-made software solution to handle all referral traffic. Initially, the program will only be open to select customers and partners, but keep a close eye on our newsletter for more information regarding the program as we roll it out.
We’re expecting the actual software component to launch early in Q4.
Over 2,000 Seller Submissions!
This was a tremendous milestone for our company.
We set this goal at the start of Q2, and at the time, we considered it to be quite a stretch goal. We didn’t hit 2,000 in Q1, and Q1 tends to be when we get the most seller submissions. It wasn’t an impossible goal though, just a hard goal to hit.
Thanks to Herculean efforts from both marketing and sales, we were able to do it.
In Q2, we had 2,150 seller submissions from entrepreneurs looking to make a life-changing exit.
This is the largest in company history, and we’re attempting to do it again in Q3. Part of how we got here is by removing the seller listing fee that we used to have. Instead, we have people verify their identity with us, which acts as a quality filter.
We’ve also reduced our exclusivity significantly.
Most M&A brokers in our industry have a 6 month exclusivity. As our 2020 State of the Industry Report says, on average it takes us around 28 days to sell a business listed in our marketplace.
Using that data, we cut our exclusivity down to just 2 months.
There is a good chance that the word has spread to entrepreneurs that we are the brokerage with one of the largest buyer networks in the industry, which in turn is driving more seller submissions our way.
In addition to all of the above, we changed our commission. That said, this change came toward the end of Q2, so it probably didn’t have a major impact on seller submissions.
Introduced Our New Blended Commission!
For years, the money we made was determined by a commission tier system that was applied when entrepreneurs wanted to sell their businesses. This system served its purpose and worked well enough for us, but it was a bit unfair for entrepreneurs who were teetering on the edge of a pricing tier.
If we charge a 12% commission on anything between $1 million to $2 million in valuation, and then 10% on anything between $2 million and $5 million, it can create problems. An entrepreneur with a business valued at $1.9 million may not be thrilled that they are so close to getting that commission cut, but will still ultimately have to sell with a 12% commission.
The new blended commission calculator helps with this issue.
Now the commission changes as your business valuation rises. It’s no longer set by large, broad pricing tiers that could result in you paying the same percentage as someone on the low end of your tier.
You can check out our new calculator here and experiment with it yourself.
First Round of Empire Flippers Capital Closed
If you haven’t heard yet, we started a new arm of the Empire Flippers brand—Empire Flippers Capital (EFC).
We’re hoping to turn EFC into a marketplace of funds so talented entrepreneurs can get the funding they need to acquire businesses, and investors can turn active investing into passive dividends for themselves.
EFC is an exciting concept that could solve a plethora of problems in our industry, where traditional financing is rarely an option.
At the end of Q2, we raised $7 million across 5 operators, and the operators started looking at acquiring businesses from our marketplace. We deployed 78% of those funds within the first 90 days.
At the time of writing, the majority of the funds have been deployed by the operators. The acquisition phase is primarily over for Round 1, and now the operators are migrating and stabilizing their businesses.
EFC also recently launched their Round Two search for operators, which has since successfully drawn to a close. The feedback was fantastic, and the EFC team were inundated with heaps of entrepreneurs looking to join the operator program.
Even though the operator program isn’t currently open, you can still fill out the EFC operator application form here if you’d like to be considered in the future.
EFC will likely be opening up additional rounds once Round 2 has been fully completed.
Speaking of round 2, it will be open for investors to start funding operator deals very shortly. If you’ve not yet registered as an investor you can do so here.
For now, EFC’s monetization is comprised of Amazon FBA, content businesses, Amazon KDP, and DTC ecommerce but there are plans to eventually expand into SaaS, and other businesses that we sell in our marketplace.
That’s a Wrap!
And there you have it, Q2 in a nutshell.
Q3 has already been an amazing quarter for us, so we’re sure the next quarterly report will have tons to report back on.
Hopefully, this report served to inspire you.
Let us know how your quarter has gone.
Here’s to an even better Q3 and Q4 to help us all close out the year strong.
If you’d like to sell your business for a life-changing exit, click here.
If you’d like to buy a profitable business, click here.

