
This Week in M&A Issue #252
 August 31, 2026

G’day mate!
Today’s trend of the week is “UPF clothing ”. 👕
Sun protection is moving beyond sunscreen and into the clothes people wear. UPF clothing, which helps protect skin from ultraviolet radiation, is gaining traction as consumers look for more ways to limit sun exposure.
UV apparel at US activewear brands was up 12% year over year in May, while 34% of full-price UPF items have sold out this year, compared with 22.6% last year. Google searches for “UV shirt” are also up 26%.
UPF clothing has been popular in East Asia for years, but the trend is now gaining momentum in Europe and the US. For online business owners, that growing interest could make UV-protective apparel an interesting and lucrative category to explore.
Today we have for you:
- US eCommerce growth hits a new high
- The domain extensions driving more eCommerce revenue
And:
- The AI tool categories with the most demand
- Amazon’s changing rules and the next wave of FBA growth
- ChatGPT has changed how it searches the web
Alright, let’s dive in.
ecommerce
.gif)
Image Source: Giphy
Double-Digit U.S. eCommerce Growth Returns
U.S. ecommerce is growing at rates not seen since the early days of the pandemic.
U.S. online retail sales hit $340.2 billion in Q2 2026, up 12.2% from the same quarter last year. That follows 10.1% growth in Q1, putting ecommerce growth at 11.1% for the first half of 2026.
That’s a big change from the slowdown that followed the pandemic. By Q2 2022, ecommerce growth had fallen to just 5.1%. Growth started improving again last year.
Online sales are also growing faster than retail overall. Total U.S. retail sales increased 6.7% in Q2, compared with 12.2% for ecommerce. Online sales now make up 17.1% of all retail sales, up from 16.3% a year ago.
Before you get too excited, it’s important to note that the figures are not adjusted for inflation, so some of the growth comes from higher prices. Amazon also moved Prime Day from July to June this year, which likely pulled some sales from Q3 into Q2.
The growth also varies quite a bit by category.
General merchandise was up 21.6%, while sporting goods, hobbies, and books grew 20.4%. Food and beverage increased 8.1%, health and personal care grew 9.3%, furniture was up 4.6%, and clothing grew just 3.8%.
The size of the category matters too. Health and personal care grew faster than clothing, but clothing actually added more sales dollars because its overall market is larger.
So while the broader ecommerce market is showing stronger demand, the opportunity still depends heavily on the category, product mix, customer base, and sales channel. The next few quarters should show whether this growth marks a lasting acceleration or a temporary spike.
The Opportunity podcast
![Amazon’s Changing Rules & the Next Wave of FBA Growth With Jana Krekic [Ep.220] (1)](https://1745913.fs1.hubspotusercontent-na1.net/hubfs/1745913/Amazon%E2%80%99s%20Changing%20Rules%20&%20the%20Next%20Wave%20of%20FBA%20Growth%20With%20Jana%20Krekic%20%5BEp.220%5D%20(1).png)
Amazon Sellers Face New Rules, AI, and Global Opportunities
The Amazon playbook is changing. Sellers are facing stricter compliance requirements, shorter titles, AI-powered search, and a growing need to think beyond their home marketplace.
In the latest episode of The Opportunity Podcast, Greg Elfrink sits down with Jana Krekic, founder of Seller Lingo, to unpack what these changes mean for Amazon sellers.
They discuss how AI tools like Rufus and Alexa could change the way sellers structure their listings, what Amazon’s tighter rules mean for categories like supplements, and why international expansion may offer opportunities that many sellers are overlooking.
Jana also shares practical insights from working with Amazon brands across multiple markets, including why simply translating a listing isn’t enough to succeed internationally.
Listen to the full episode to hear Jana’s take on where Amazon is heading and how sellers can adapt.
eCommerce
.Org Ecommerce Sites Are Outperforming .Com by 34%
For years, choosing a domain name for an ecommerce business was relatively straightforward: if you could get the .com, you took it. New data from Wix suggests that strategy may be worth reconsidering.
Wix analyzed domain registrations and performance data from 2025 and 2026 and found that .com still dominates, accounting for 82% of Wix websites in the US. People are also 13 times more likely to choose a .com than any other extension.
But alternative domains are increasingly showing stronger performance. The biggest surprise is .org.
Wix found that .org websites are 34% more likely to generate ecommerce revenue than .com sites and receive 3% more site sessions.
The .store extension is also performing well. Ecommerce sites using .store generate 10% more revenue than .com sites, while earning twice the revenue of .shop and .net sites. Registrations of .store, .online, and .shop domains doubled between January and May 2026.
Technology-focused extensions are growing quickly too. .ai registrations increased 20% during the same period, making it the 10th most popular extension in Wix’s data. .io registrations also increased 32 times in May.
Geography still matters. .com dominates in countries including the US, South Africa, India, and Japan, while local extensions remain more popular in Germany, the Netherlands, and Switzerland.
For ecommerce store owners, the data suggests domain selection is becoming more flexible. A .com is still valuable, but it is no longer the only option that consumers appear comfortable buying from.
There is also a case for buying domains defensively. Beyond protecting your brand name, businesses may want to secure relevant keyword domains across extensions that competitors could otherwise claim.
Read All About It!
📱 How a solo app builder runs his $40k/month business: a day in the life
🌐 How to check if a domain name is available: and what to do if it’s taken
🔥Trending topics for August 2026: top 100 trending topics right now
👨💻 The best free vibe coding tools: build apps for free
AI
The AI Tool Categories Getting the Most User Demand
Thinking about building an AI tool? The biggest question probably isn’t whether people want AI. It’s what they actually want to use it for.
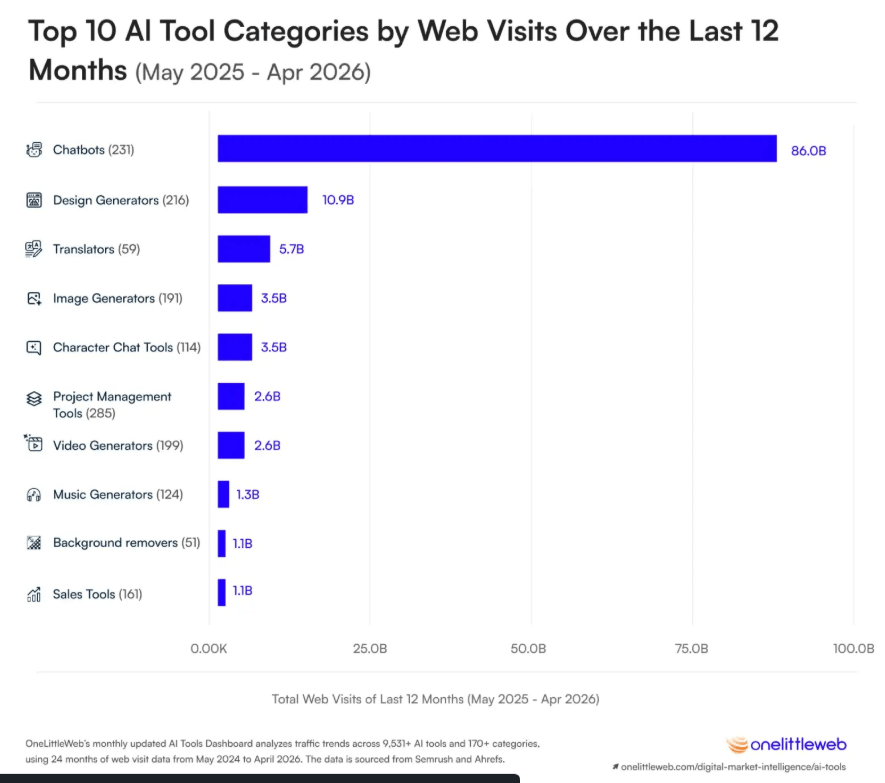
OneLittleWeb analyzed 9,531 AI tools and their web traffic to see which categories are getting the most attention. Looking at web traffic from May 2025 to April 2026, it found that some AI categories are attracting significantly more demand than others.
Unsurprisingly, Chatbots are in a league of their own. They generated 86 billion visits over the past year, accounting for 59.5% of all AI tool traffic. That’s up 90.8% from the previous year. This category includes ChatGPT, Gemini, Claude, Grok, and Perplexity, so it’s already highly competitive.
Design is the next big category, generating 10.9 billion visits. But there’s a catch. Canva accounts for 96.3% of that traffic, making it a difficult market for a new general-purpose design tool to break into.
Translation is another huge category, with 5.7 billion visits, but traffic fell 22.5%. With translation increasingly available inside general-purpose assistants, users have less reason to visit a dedicated tool.
Some of the smaller categories look more interesting from a growth perspective.
Video generators grew 31.2% to 2.6 billion visits, while music generators grew 21.2% to 1.3 billion. Image generators attracted 3.5 billion visits, although traffic was basically flat.
Project management is worth watching too. Traffic grew 18.6% to 2.6 billion visits, and the category includes 285 different tools. Unlike design, there isn’t one company dominating the market.
The biggest category isn’t always the best opportunity. A large market with strong growth and plenty of room for different products can be much more interesting than a huge category that’s already dominated by one or two platforms.
AI Search
What ChatGPT’s New Search System Means for Businesses
ChatGPT has quietly changed how its web search works.
A recent analysis by Search Engine Journal of ChatGPT’s search activity found that OpenAI has rebuilt parts of its search system. The new setup gives us a better look at how ChatGPT decides what to search for, how recent information needs to be, and which sources it uses.
ChatGPT doesn’t search everything the same way
One of the interesting changes is that ChatGPT adjusts its searches depending on what you’re asking.
For example, searches for stock information may focus on the past two days, while sports searches can look at the past week. Commercial research may use a 30-day window, while earnings information can use 90 days.
ChatGPT also has separate systems for products, businesses, and images. That matters because getting your website into Google is only part of the picture. If you’re selling products, your products may also need to appear in the data ChatGPT uses for product searches. Local businesses face a similar issue.
Sometimes ChatGPT doesn’t need a website
ChatGPT is also making greater use of built-in tools and widgets.
Instead of searching several websites to answer something like a sports schedule or stock question, it can pull the information into the response itself.
For businesses, this could mean fewer opportunities to get a website visit or citation for certain types of searches.
Reddit is worth paying attention to
Another interesting finding is how often ChatGPT searches Reddit when researching products and businesses.
Those Reddit results don’t always appear as citations in the final answer. However, the analysis suggests they could still influence what ChatGPT ultimately says.
AI search is changing quickly. Strategies based on how ChatGPT worked a few months ago may already be outdated, making it important to monitor how your brand, website, and content actually appear in AI searches.
Money Nomad

Looking for a side hustle?
Try Money Nomad, our sister marketplace built specifically for profitable side hustles and micro-businesses that are too small for Empire Flippers.
Check out this recent listing available on the Money Nomad Marketplace:
Listing #10159 – $27,678.00
lead generation | home & garden
Established Canadian lead generation business in the home services niche, generating $1,035/month in revenue with 95%+ profit margins. Built entirely on organic local SEO with strong Google rankings, this 8+ year old site requires only 1-3 hours weekly and operates with zero ad spend. Learn More
Subscribe to the This Week in M&A Newsletter
to Get Content like This in Your Inbox Every Friday
