15 Tools for the Perfect Infographic Creation
 Updated on February 29, 2020

At first, the world of web design may seem like a daunting black hole of coding and advanced software, especially to someone who has no experience with the amount of fine tuning and detail that is actually involved. However, most professionals are self-taught, having learned the tricks of the trade through trial and error. You may not become a graphic design Rain Man, but with the help of these innovative sites, you can learn a few of these tricks as well.
Infographic Generators
Thanks to the wonderful world of the internet and a few creative minds, the user-friendly (and mostly free) infographic generator was born.
Infographics are a way to visually represent an idea through eye-catching creative images, which captivate the short-attention span of consumers, who are always looking for accessible information. These websites were built to handle the coding side of web design, while allowing the user to create eye-catching graphics.
Images are processed by the brain at a much faster rate than words, and a few sharp illustrations on a webpage can go a long way.
Instead of shelling out the money to have someone create an infographic for you, why not start out 2017 learning something new and do it yourself? With a little effort and a great guide to some resources, the finished product will look clean-cut and polished.
Tools to Make it Cheap and Easy
When creating an infographic, everyone wants the finished product to appear as if it were professional work. However, the costs of paying a pro could run anywhere from $100 for the bare minimum to $1,000 for a full-page graphic from websites such as only-infographics.com and supertasker.com. Photoshop is a great resource for the expert, but can be hard to navigate for a novice, and is very time-consuming when creating something from scratch.
That’s where infographic generators come in.
These websites focus on simple user interface (WYSIWYG = What You See Is What You Get) that allows even the most amateur to create a professional design. They also offer “freemium” packages that not only let you to test the software, but actually create a product using their free templates. For just a few dollars a month, you can have full access to all the tools and images the website offers.
Look no further, the free tools you need to build some really eye-catching and unique images that will make your views skyrocket are all right here.
While they all display a user-friendly interface that is simple and well-organized, they certainly vary in levels of accessibility, quality, and specialization. Yet with the level of stiff competition among different providers, new innovative techniques are always right around the corner.
Piktochart

With a super simple design, Piktochart is great for beginners. It provides a user-friendly editor that “holds your hand” throughout the production process, and features over 400 pre designed templates, 4,000 prefabricated images and icons, as well as high resolution downloads. There is also a presentation mode for live demonstrations in meetings and high quality resolution for printing. The site uses simple click and drag format and is easy to use, while creating the same finished product that advanced design software can achieve.
Venngage

Data representation is high on this graphic generator’s list of features. There are a wide variety of charts and maps to choose from and also a free-form design canvas, which allows for total control of placement and size of icons and images. With an emphasis on social media, it is easy to publish, embed, and download your illustrations and images and share with anyone, publicly or privately. The free trial only allows for the creation of five infographics per day and these graphics will be branded with the Venngage logo.
Easel.ly

Easel.ly is a simplified version of some of the other infographic tools available. With only six commands (templates, objects, backgrounds, shapes, text, and upload), it reduces the task by simplifying design into self-explanatory categories. It is an effective tool for creating quick graphics that are clear and easy to understand. This site is great for education, and is often used in schools and universities as an introduction to online design.
Visme.co
With multifunctional project options, Visme.co takes the place of a myriad of different programs. From infographics and banners to presentations and blank canvases, this site allows for simple and effective production without the extra bells and whistles. A simplified search function makes it easy to find an image or icon to fit any project. One-click security makes it easy to protect and hide your work from the public.
Canva

This site can help with designing cards, book covers, logos, photo collages, letterheads and much more. Like the others, Canva offers many additional images in its library, but they each cost $1. Despite this expense, Canva also offers many additional perks for free that other sites only include in their monthly upgrade package. If a simple and effective medium for creating and editing existing images from your own library is most important, than Canva is right for the job. There is also an app available for Apple products for editing and creating on the go.
Visualize.me

With a focus on resume construction, Visualize.me is an excellent resource for a polished, interactive bio. It boasts the “future of resumes.” With many options from an experience timeline to a skills bubble chart, Visualize.me has created an easy, innovative way to display a resume in a new, creative way. If your standard letterhead style resume is just not getting the attention it deserves, than creating a colorful, interactive display could lead to great things.
Infogr.am

With 35 different charts and 500 map options to choose from, Infogr.am has an emphasis on data collection and charting. It can also connect its user to many different data sources, including the Public World Bank, the UN, and Google Analytics directly from the site. There are also interactive GIF charts and maps that allow users to see the animation from one data set to the next. It utilizes an Excel style spreadsheet that is simple to input and change information in, while being able to view the changes directly on the graph or chart.
GetAbout.Me

A free Windows app that analyzes social media activity, optimizes images that generate more traffic, and evaluates how you connect with others. There is also an analysis generator that monitors not only your own activity, but also top-trending Twitter and Facebook topics, helping you to further help enhance social media presence.
Google Developers
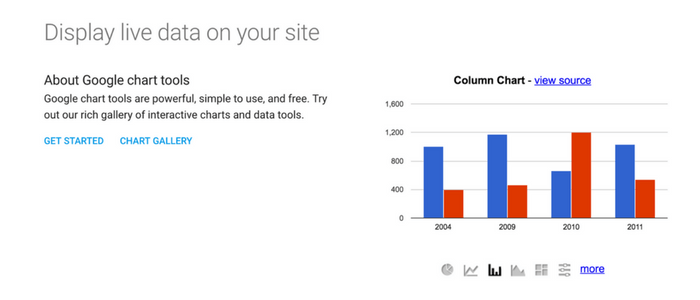
Within the Google empire, there is a free resource for creating infographics, particularly charts. The Google Chart tool is a great simple option and allows for changing and adjusting data in real time. The many options of charts and graphs to select from all exude the staple Google look, and so are recognizable and familiar to readers and users alike. There is also the chart wizard, a tutorial tool which provides simple step-by-step instructions as well as troubleshooting to further simplify the user experience.
Wordle
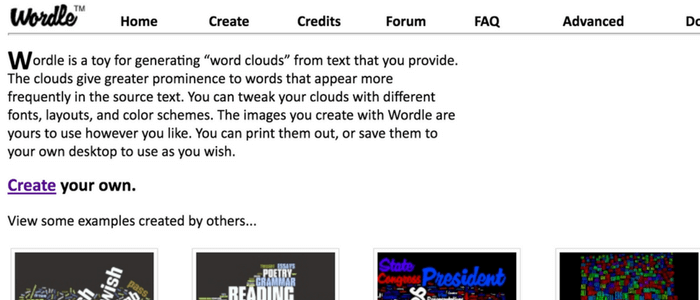
A word cloud is a cluster of keywords, varying in size from most relevant to least relevant. They give prominence to more frequently appearing words and themes. It is a way to organize thoughts and ideas in a visually appealing image that the brain is able to naturally assimilate. Although this site has only one function, it is straightforward and very simple. There are no limits as to how many you can create and it is easy to print out or save for future use.
Creately

This website is more at the advanced end of the options listed, and has an emphasis on real time collaboration and diagramming. Although the free trial only allows for five public diagrams, if this product fits your needs, it may be worth the small fee. The collaboration aspect is useful for sharing information via email and changes can be made from both parties in real time, so it feels like you’re sitting in the same room. There is also space for comments and discussion threads so all edits and changes can be easily monitored and adjusted while they are happening.
ChartsBin

This is a great resource, not just for creating your own charts but also for getting free access to many prefabricated maps and charts with a dataset that covers everything from drugs and crime stats to the relative wealth of different countries around the world. It uses flash, so you may have to download that as well, but the good news is it’s free.
Plot.ly
This site is another collaboration platform and affords users more advanced capabilities. The Plot.ly cloud is space for access to scientifically accurate maps and graphs, as well as a place to share ideas. It also has a live feed for users to publish and share their graphs. The cloud also allows for direct collaboration on the site without the use of email. There is also the Plot.ly blog available as a resource, with the latest news and helpful hints and pointers on how to optimize your experience.
Chartblocks

Chartblocks is another helpful resource for creating effective and easily understandable graphs and charts. It is oversimplified in that there are only five templates to choose from as a free member and a few templates that offer different color palettes. However, sometimes too many options can be just as overwhelming as trying to start from scratch. One additional function is that the data import wizard will help to sort through the information provided and select relevant stats and suggestions on the proper template to use based on the information provided. There is also a Chartblocks blog meant to create a community and conversation.
RAW

Although this site only deals with chart graphics, RAW has 16 charts as well as the option to design your own chart, rather than just a few options of bar graphs and charts to choose from. Another perk is that there is no registration required and you can get straight to work. Once the data has been input and the chart type selected, the job is done, because the minuscule details about style and color are taken care of for you.

Just Dive In
With so many infographic generators available and new ones popping up left and right, the best bet is to cruise the internet and click around on a few.
Although most are similar, you may find you prefer one site over another based on some of the finer details, and your specific needs for projects.
Every website on this list does offer a freemium package, meaning access to some of the site’s function for free, so you have the option of testing the waters without losing much investment.
These infographic tools really do make graphic design attainable to anyone. Make your life a lot easier and your pockets a little heavier by checking out one of these super simple websites, and have fun learning a new skill.
Photo credit: Rawpixel